Welcome to Cherry Times


Insect-proof nets can influence the microclimate of an orchard plot. The Ceris'innov project examines various climatic indicators to better understand how to combine pest protection with resilience to climate change.
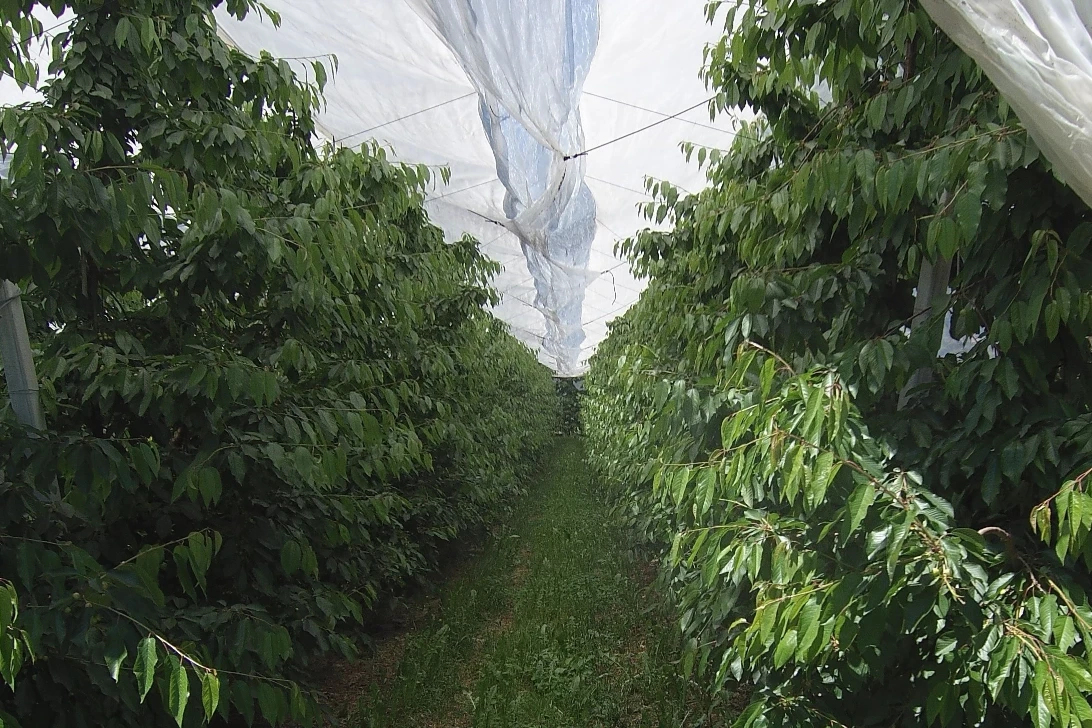
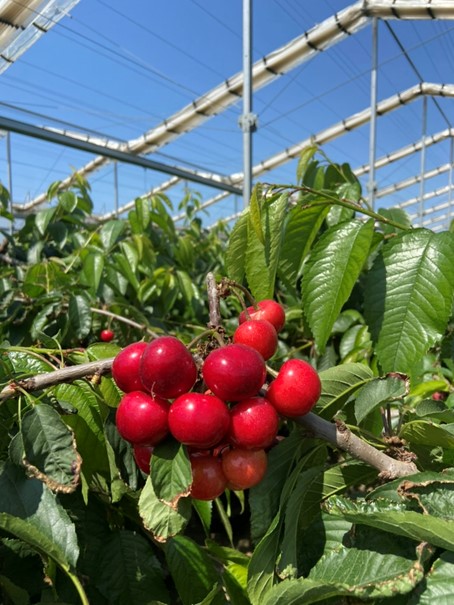
The Ceris'innov project studies the technical and economic feasibility of growing cherry trees in single-plot systems under insect-proof nets, combined with limited use of pesticides, including insecticides, fungicides, and herbicides. The single-plot net protects the orchard throughout the year.
Its structure facilitates maintenance and harvesting operations, which are sometimes difficult to perform with row-based net systems. The net protects the trees regardless of their shape. The main objective is to control Drosophila suzukii. A protective cover is deployed before flowering and folded back after harvest.
The presence of the net modifies the microclimate of the plot, which is the focus of this article. The impact of the structure on production will be addressed in a subsequent article.
The net is supplied by Filpack. It is the Alt Mouches 6x6 model (1.38 × 1.38 mm; 85 g/m²; monofilament diameter: 0.28 mm). The net provides a theoretical shading of 18%. The single-plot net structure is 4 meters high. The perimeter net is buried one meter deep to ensure maximum sealing. Each row is covered by two stretched net sections.
The plot is protected by a rain cover, positioned between the cherry trees and the insect-proof net. The Anisolar+ rain cover is made of high-density polyethylene (HDPE) weighing 140 g/m². It is reinforced with 400 g/m² side panels and a polypropylene rope reinforcement. The cover is coated with 40 g/m² plastic and has a mechanical resistance of 120 N per 5 cm.
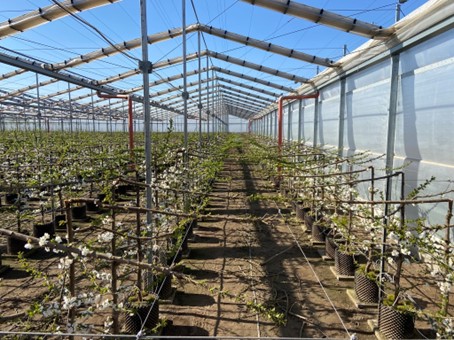
The plot consists of 8 rows with 25 trees each: 3 rows of the early variety Nimba cov, 2 rows of the mid-season variety Babelle cov, and 3 rows of the late variety Staccato®. These trees are grafted onto KRYMSK® 6 and PiKU® 1, two dwarf and productive rootstocks that bear fruit quickly. Three trees per row serve as pollinators for Nimba cov, which, unlike the other two varieties, is not self-fertile.
The rows are spaced 3.40 m apart and trees are spaced 2 m apart. The trees are trained along a central axis. The plot is managed as a planar hedge with partially mechanized pruning. Pollination is ensured by bumblebees, whose hive is installed inside the plot at the beginning of flowering. The total covered area is 1,360 m².
Twenty-two weather sensors were distributed across nine measurement points within the net-covered plot. The data presented in this article come from three sensors located at the center of the orchard, considered the most representative area of internal plot conditions.
These data are compared with those from a similar control plot, not covered by nets, located in close proximity to the covered plot. The analysis presents the main results from 2023 and 2024 data. Data collection will continue in 2025.
Data from other sensors positioned under the net will be presented later in a border-effect analysis of the net on microclimate, in order to account for microclimatic conditions across the entire study area.
Three types of sensors are used: the Davis Sensirion SHT85 Abri sensor for temperature and humidity under the structure, the Davis anemometer for wind speed and direction, and the Apogee pyranometer for radiation. These sensors are connected to Agribase 3ST units supplied by Agriscope. These units transmit data via Sigfox radio signal, with access through an online platform.
In May and June 2023, average daily maximum temperatures under the single-plot net were +2°C higher, suggesting a potential warming trend (Figure 1). However, minimum temperatures were identical or slightly lower under the net, at -0.1°C, while the average temperature was +0.8°C. The protected plot showed greater temperature variability than the control plot.
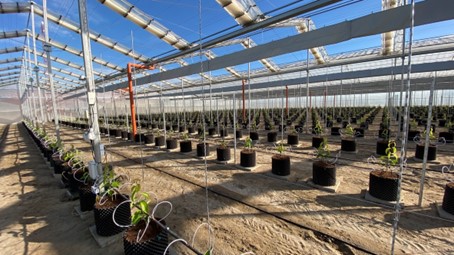
Figure 2 shows temperatures in August 2023, during the hottest periods of the year. Unlike spring, temperature differences during this hot period are less pronounced: +0.8°C under the single-plot net for maximum temperatures and +0.2°C for average temperatures. Minimum temperatures follow the same trend as in spring but are lower: -0.4°C under the net. The risk of overheating under the net is therefore ruled out.
This is confirmed by the analysis of temperatures on a particularly hot day in August, when temperatures reached nearly 40°C, but the maximum difference between treatments was only 1.5°C (Figure 3). However, cumulative hours above 30°C for July and August 2023 were 353 hours under the net, compared to 277 hours in the control plot, representing an excess of 76 hours under the single-plot net. This significant difference could increase the risk of double fruit formation under the net.

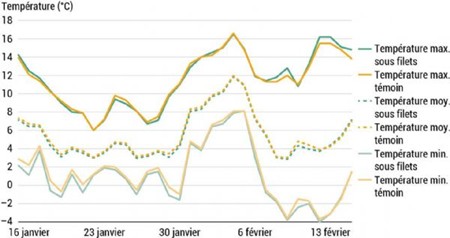
Between the control plot and the single-plot net system, temperature differences decrease during winter months: +0.08°C under the net for maximum temperatures, -0.2°C for average temperature, and -0.4°C for minimum temperatures (Figure 4). However, the single-plot net shows slightly lower minimum temperatures than the control plot, which could increase frost risk, as shown by data from a frost night in January 2024 (Figure 5).
Nevertheless, since the beginning of the trial, frost events have been rare and of low intensity. This makes it difficult to measure the true effect of the net. Moreover, other studies have demonstrated a protective effect of nets against frost. Observations should continue to draw conclusions about the potential role of nets in reducing frost risk.
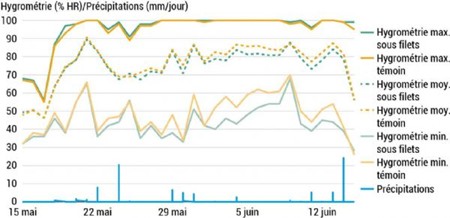
The indicator used to measure humidity is hygrometry, i.e. the percentage of relative humidity in the air. Daily maximum hygrometry values are the same in both the control plot and under the single-plot net (Figure 6).
However, differences are observed in minimum values: under the net, these are on average 4.4% lower. The protected plot tends to dry more quickly and more intensely after rainfall. In addition, average daily hygrometry under the net is 1.8% lower.
This confirms a less humid atmosphere under the net compared to the control plot, influenced by the presence of rain covers. Finally, wind speed is significantly reduced by the net: during the study period, average wind speed in the control plot was 16.5 km/h, compared to just 3.6 km/h under the net.
For example, on a particularly windy day, maximum wind speed reached 70 km/h in the control plot compared to 18 km/h under the net.
Humidity partly affects the presence of brown rot in cherry trees. It is not possible to draw conclusions on the positive influence of single-plot net covering on the spread of this fungus. In some cases, humidity under the net was higher than in the uncovered control orchard, thus contributing to greater brown rot development.
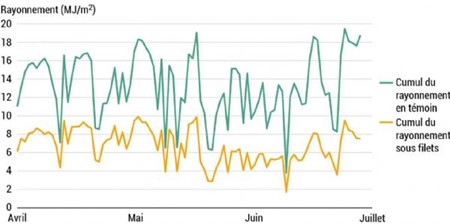
Radiation refers to the amount of solar energy received by the plot in a single day. Between April and July, a key period for cherry phenology, the single-plot net reduces incoming radiation by an average of 6.6 MJ/m² compared to the control plot (Figure 7).
For comparison, typical summer radiation in southern France reaches about 20 MJ/m² per day: the net therefore intercepts more than a quarter of daily sunlight. However, no differences in phenology are observed between the two plots: flowering, véraison, and ripening dates are identical.
The reduced solar energy under the net may also explain lower minimum temperatures: sunlight struggles to reach and warm the soil. This reduction in radiation could affect production, such as reducing fruit number in the lower parts of the trees or altering tree structure, with a more elongated shape to reach light.
The Ceris'innov project has improved understanding of the effects of single-plot net covering on the microclimate of protected orchards. However, these observations need to be confirmed over several years to include a wider range of climatic conditions.
In the context of climate change, it is essential to anticipate potential unintended climatic effects of these insect protection measures, such as the intensification of extreme summer temperatures, while also identifying their potential benefits.
In addition to being effective against Drosophila suzukii, nets could help reduce risks associated with increasingly adverse climatic conditions, such as limiting sunburn on fruit.
The use of single-plot nets in cherry orchards is an effective method for controlling Drosophila suzukii, but it also affects the microclimate of the plot. Thermal amplitude increases, with higher maximum temperatures and slightly lower minimum temperatures, especially in spring. Heat waves, however, are only slightly amplified.
Humidity under the nets appears to be lower than in a control orchard, and incoming solar radiation is significantly reduced. Nevertheless, no impact on phenology is observed.
Amandine BOUBENNEC, Laurent ROSSO, Anaïs PICAMA, Anna GAUTIER - CTIFL
Source: CTIFL NEWS, 2025