Introduction
Precision agriculture is inconceivable without the recent advancements in technology. Among these, soil-plant-atmosphere sensors and multispectral images acquired from unmanned aerial systems (UAS) are frequently used to improve crop management.
In recent years, numerous studies have reported promising results for multispectral images based on UAS systems in crop and soil condition remote sensing, as well as in detecting pests, diseases, and water and nutrient stress in field crops and, to a lesser extent, in fruit trees.
Vegetation indices and their applications
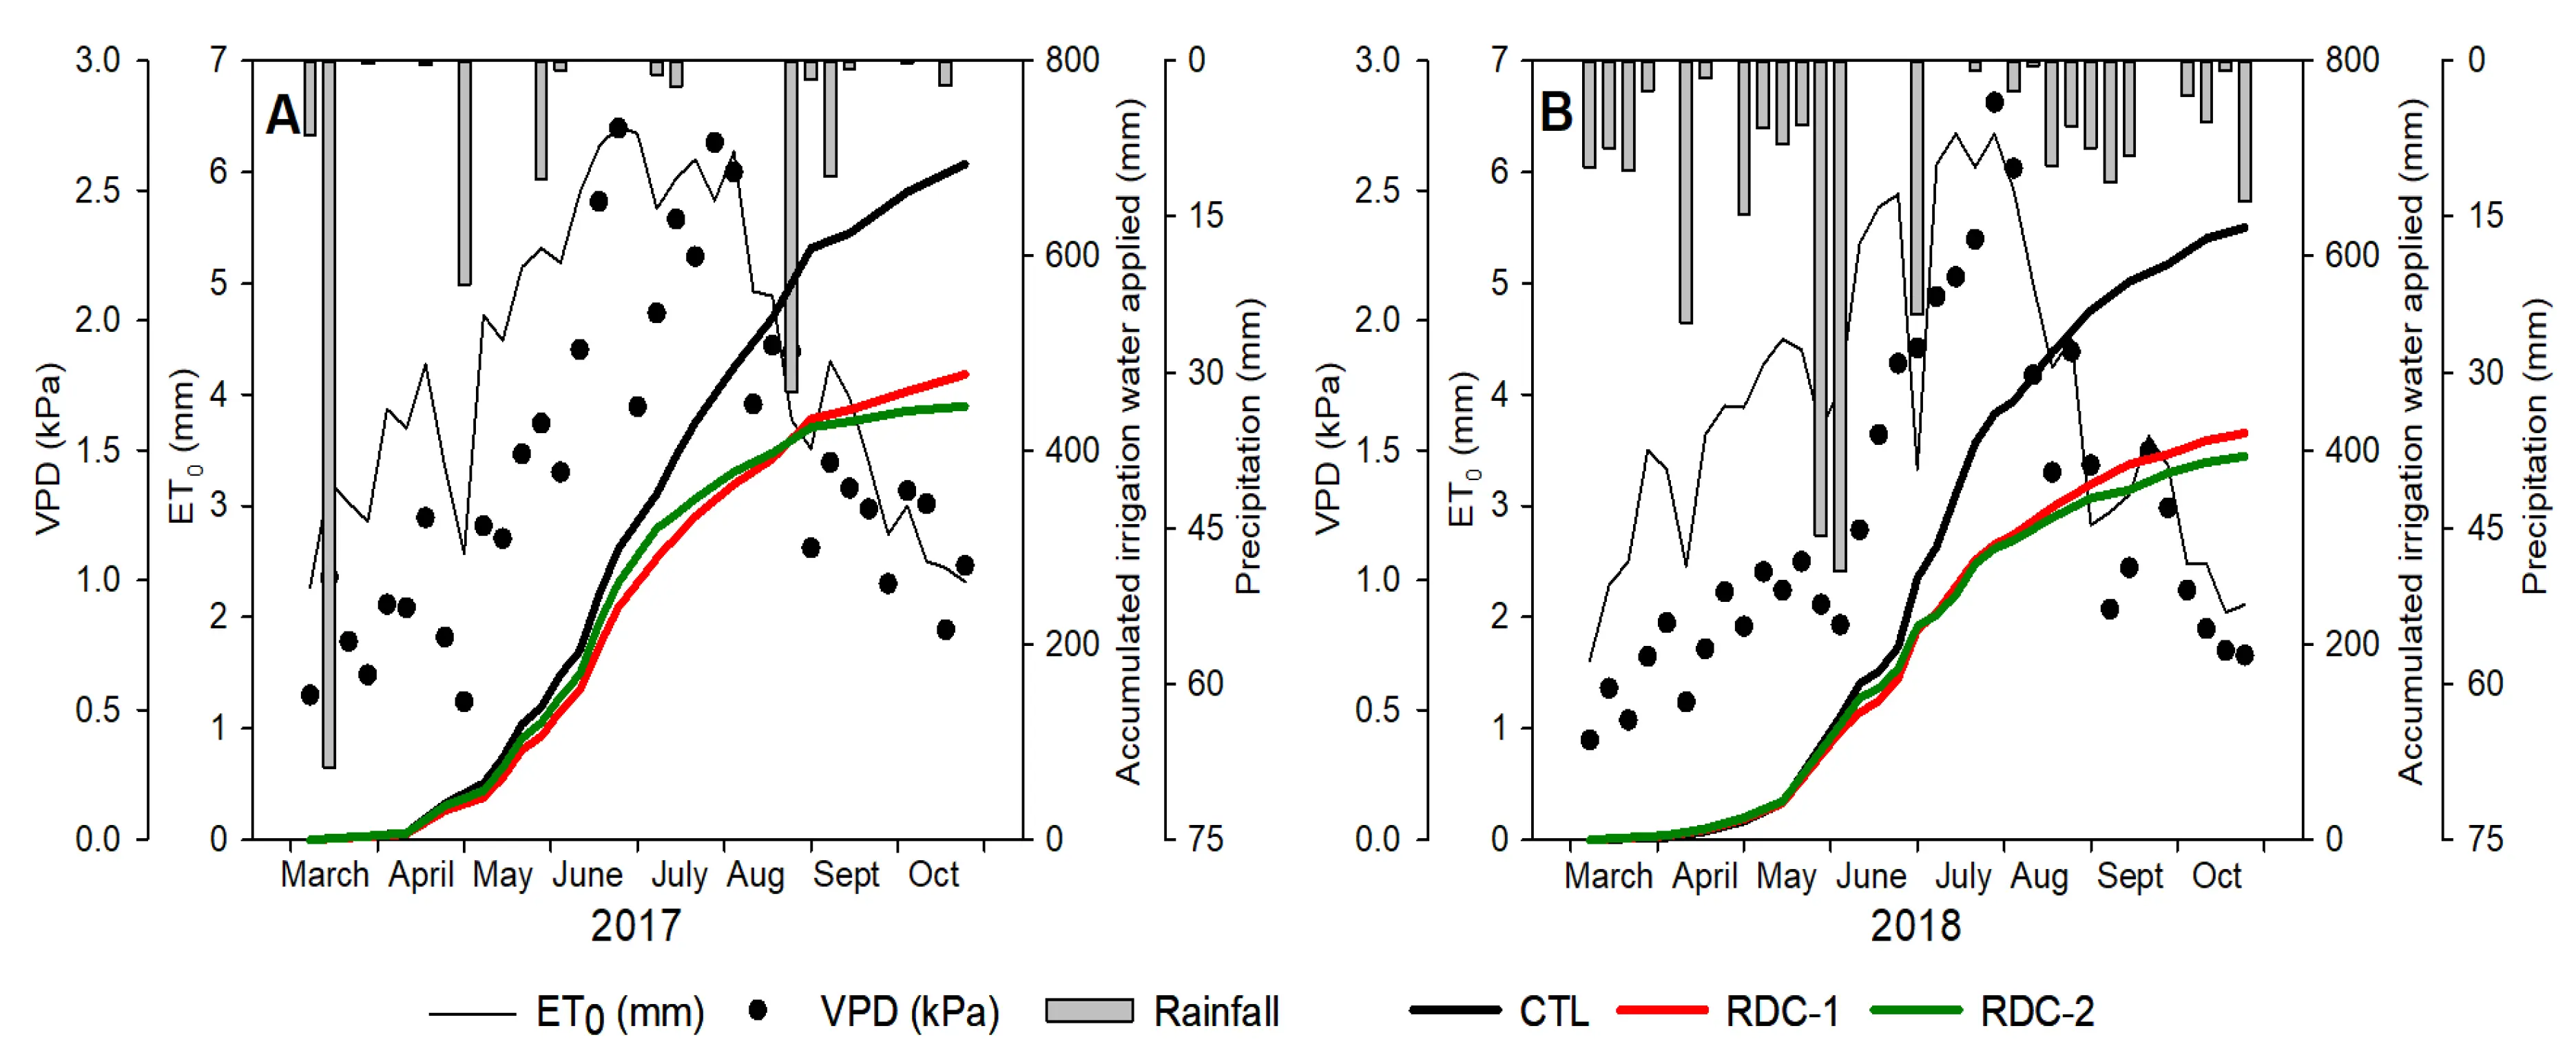 Figure 1. Seasonal evolution of weekly mean air vapor pressure deficit (VPD) and reference evapotranspiration (ET0) and accumulated weekly precipitation and accumulated irrigation water applied to each treatment during the season 2017 (A) and 2018 (B) in the ‘Prime Giant’/SL64 sweet cherry orchard in Jumilla (Spain).
Vegetation indices are frequently calculated using multispectral aerial images, which are a composite of the proportion of light reflected by the foliage in the visible, red-edge, and near-infrared regions of the electromagnetic spectrum.
The optimized soil adjusted vegetation index (OSAVI), the normalized difference vegetation index (NDVI), the difference vegetation index (DVI), and the normalized difference red edge index (NDRE) are among the most commonly used vegetation indices.
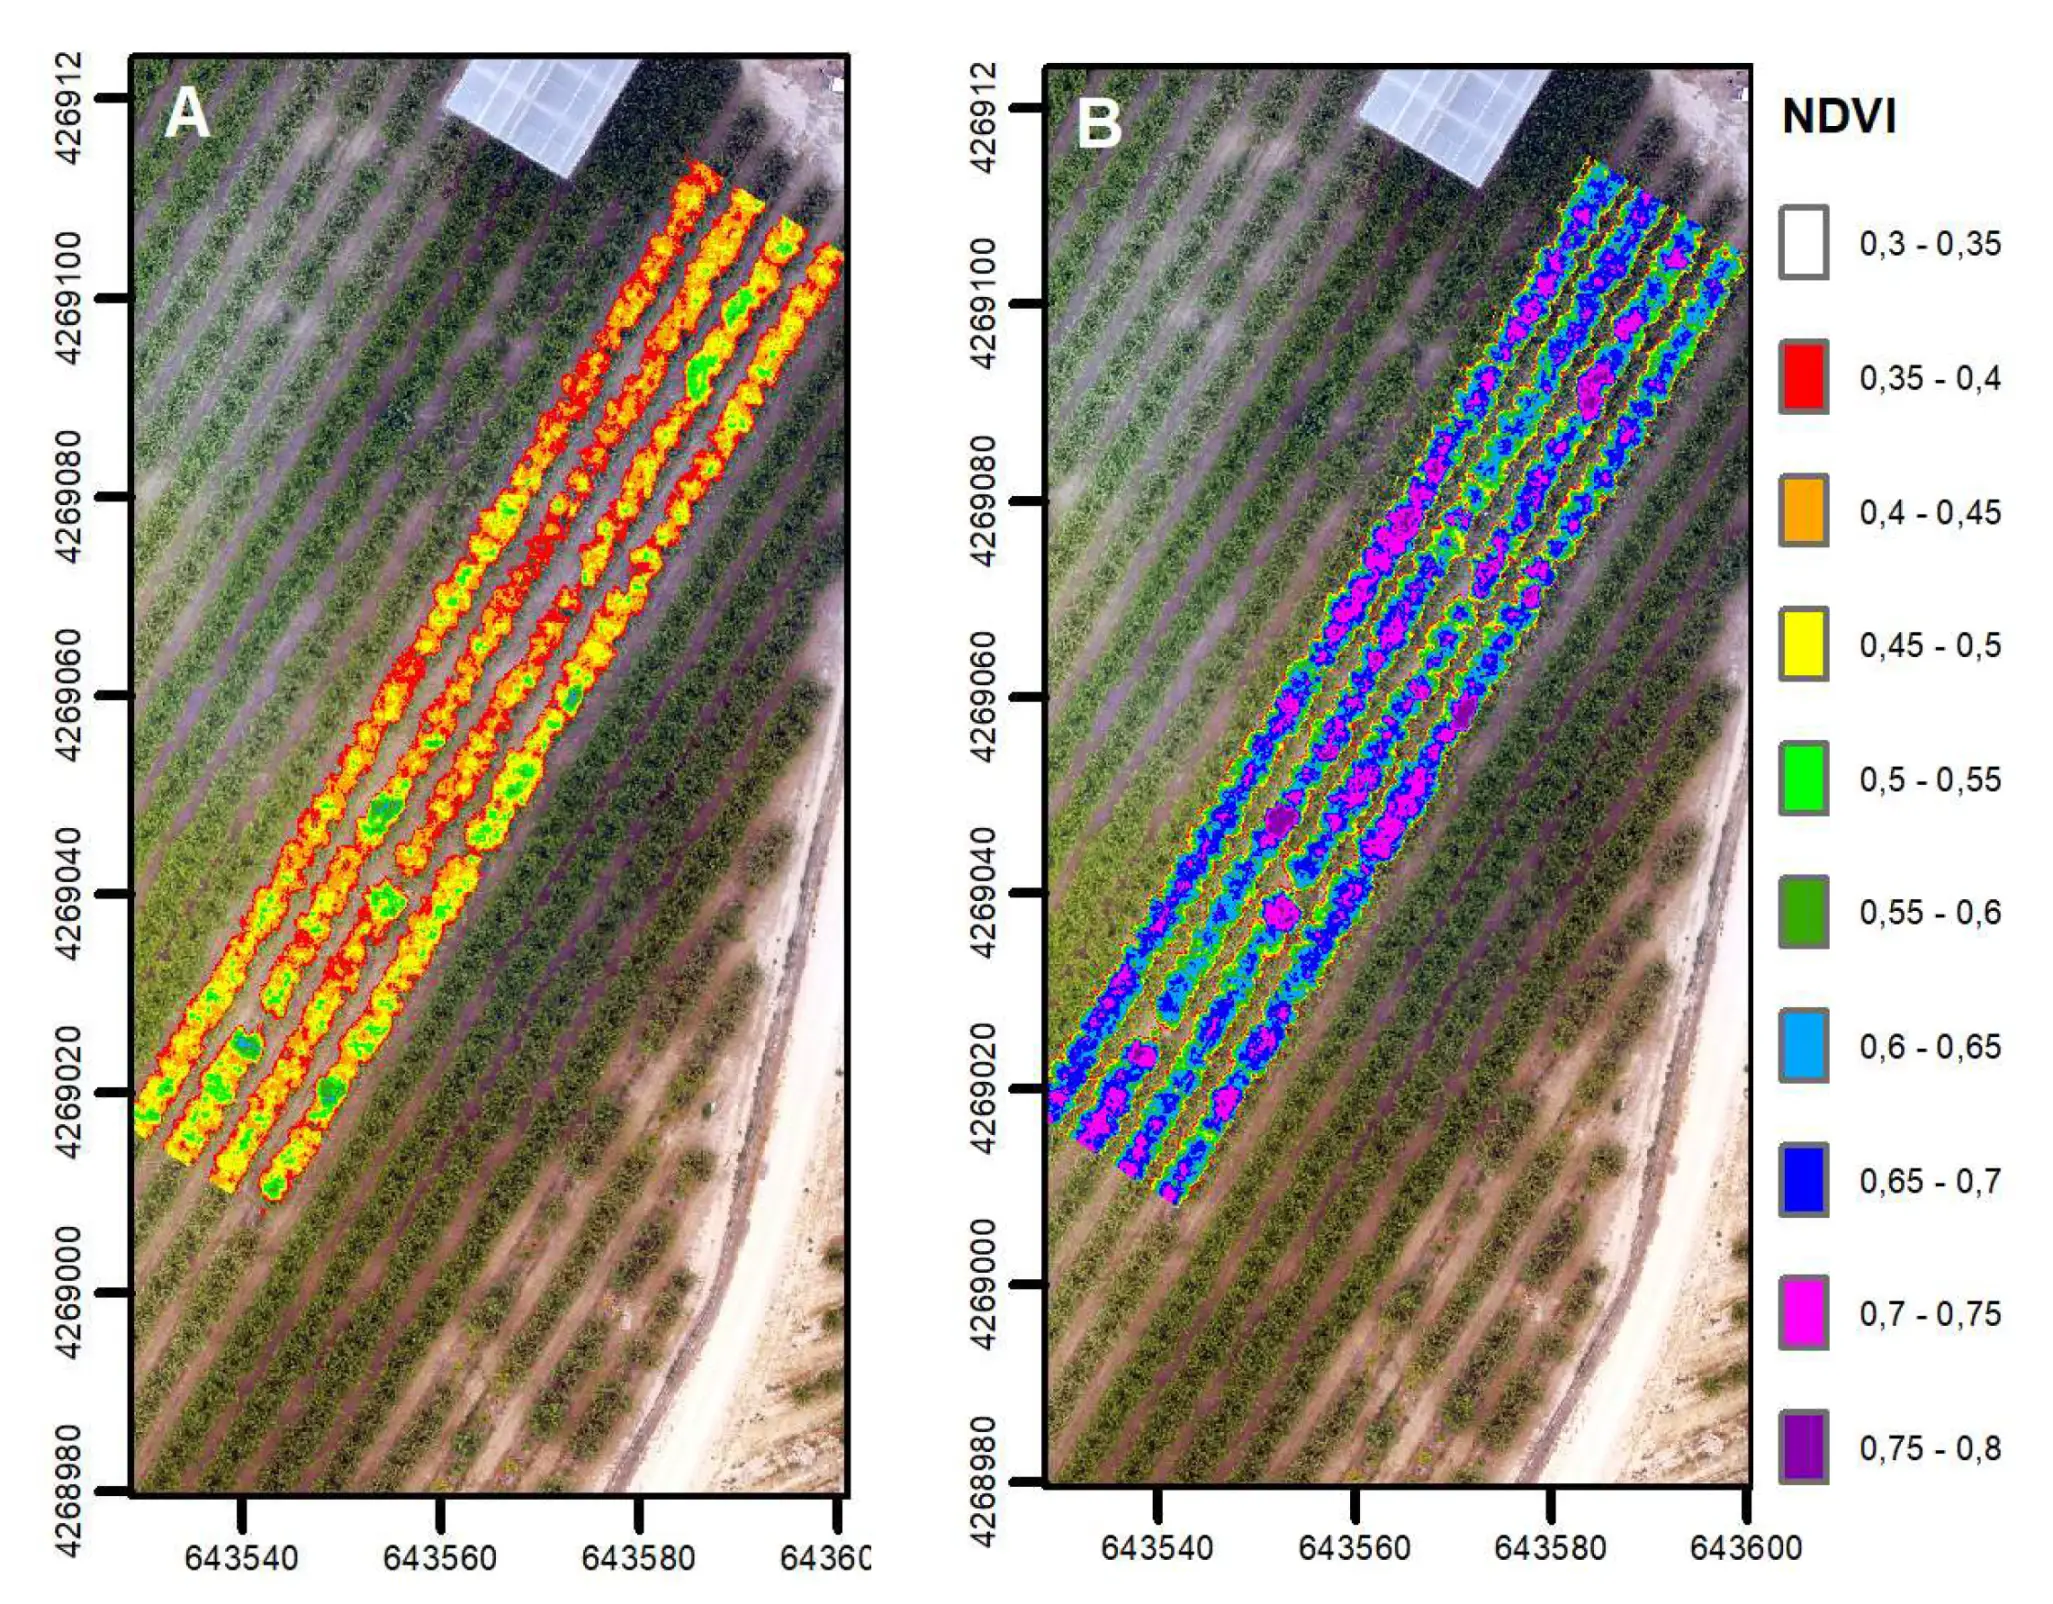 Figure 2. Normalized difference vegetation index (NDVI) distribution map of the sweet cherry orchard in 2017 preharvest (A) and postharvest (B).
The NDVI is the most frequently used index, based on the unmanned system. It is directly correlated with plant health and chlorophyll content. In horticultural crops and fruit trees, it has been described as a reliable indicator of water status.
Another potential application of vegetation indices obtained from multispectral images is their possible use as a parameter in estimating leaf area and product yield. The prediction of harvest timing for sweet cherry trees could be a promising parameter to estimate, with interesting forecasts for harvest times.
Study objective and methodology
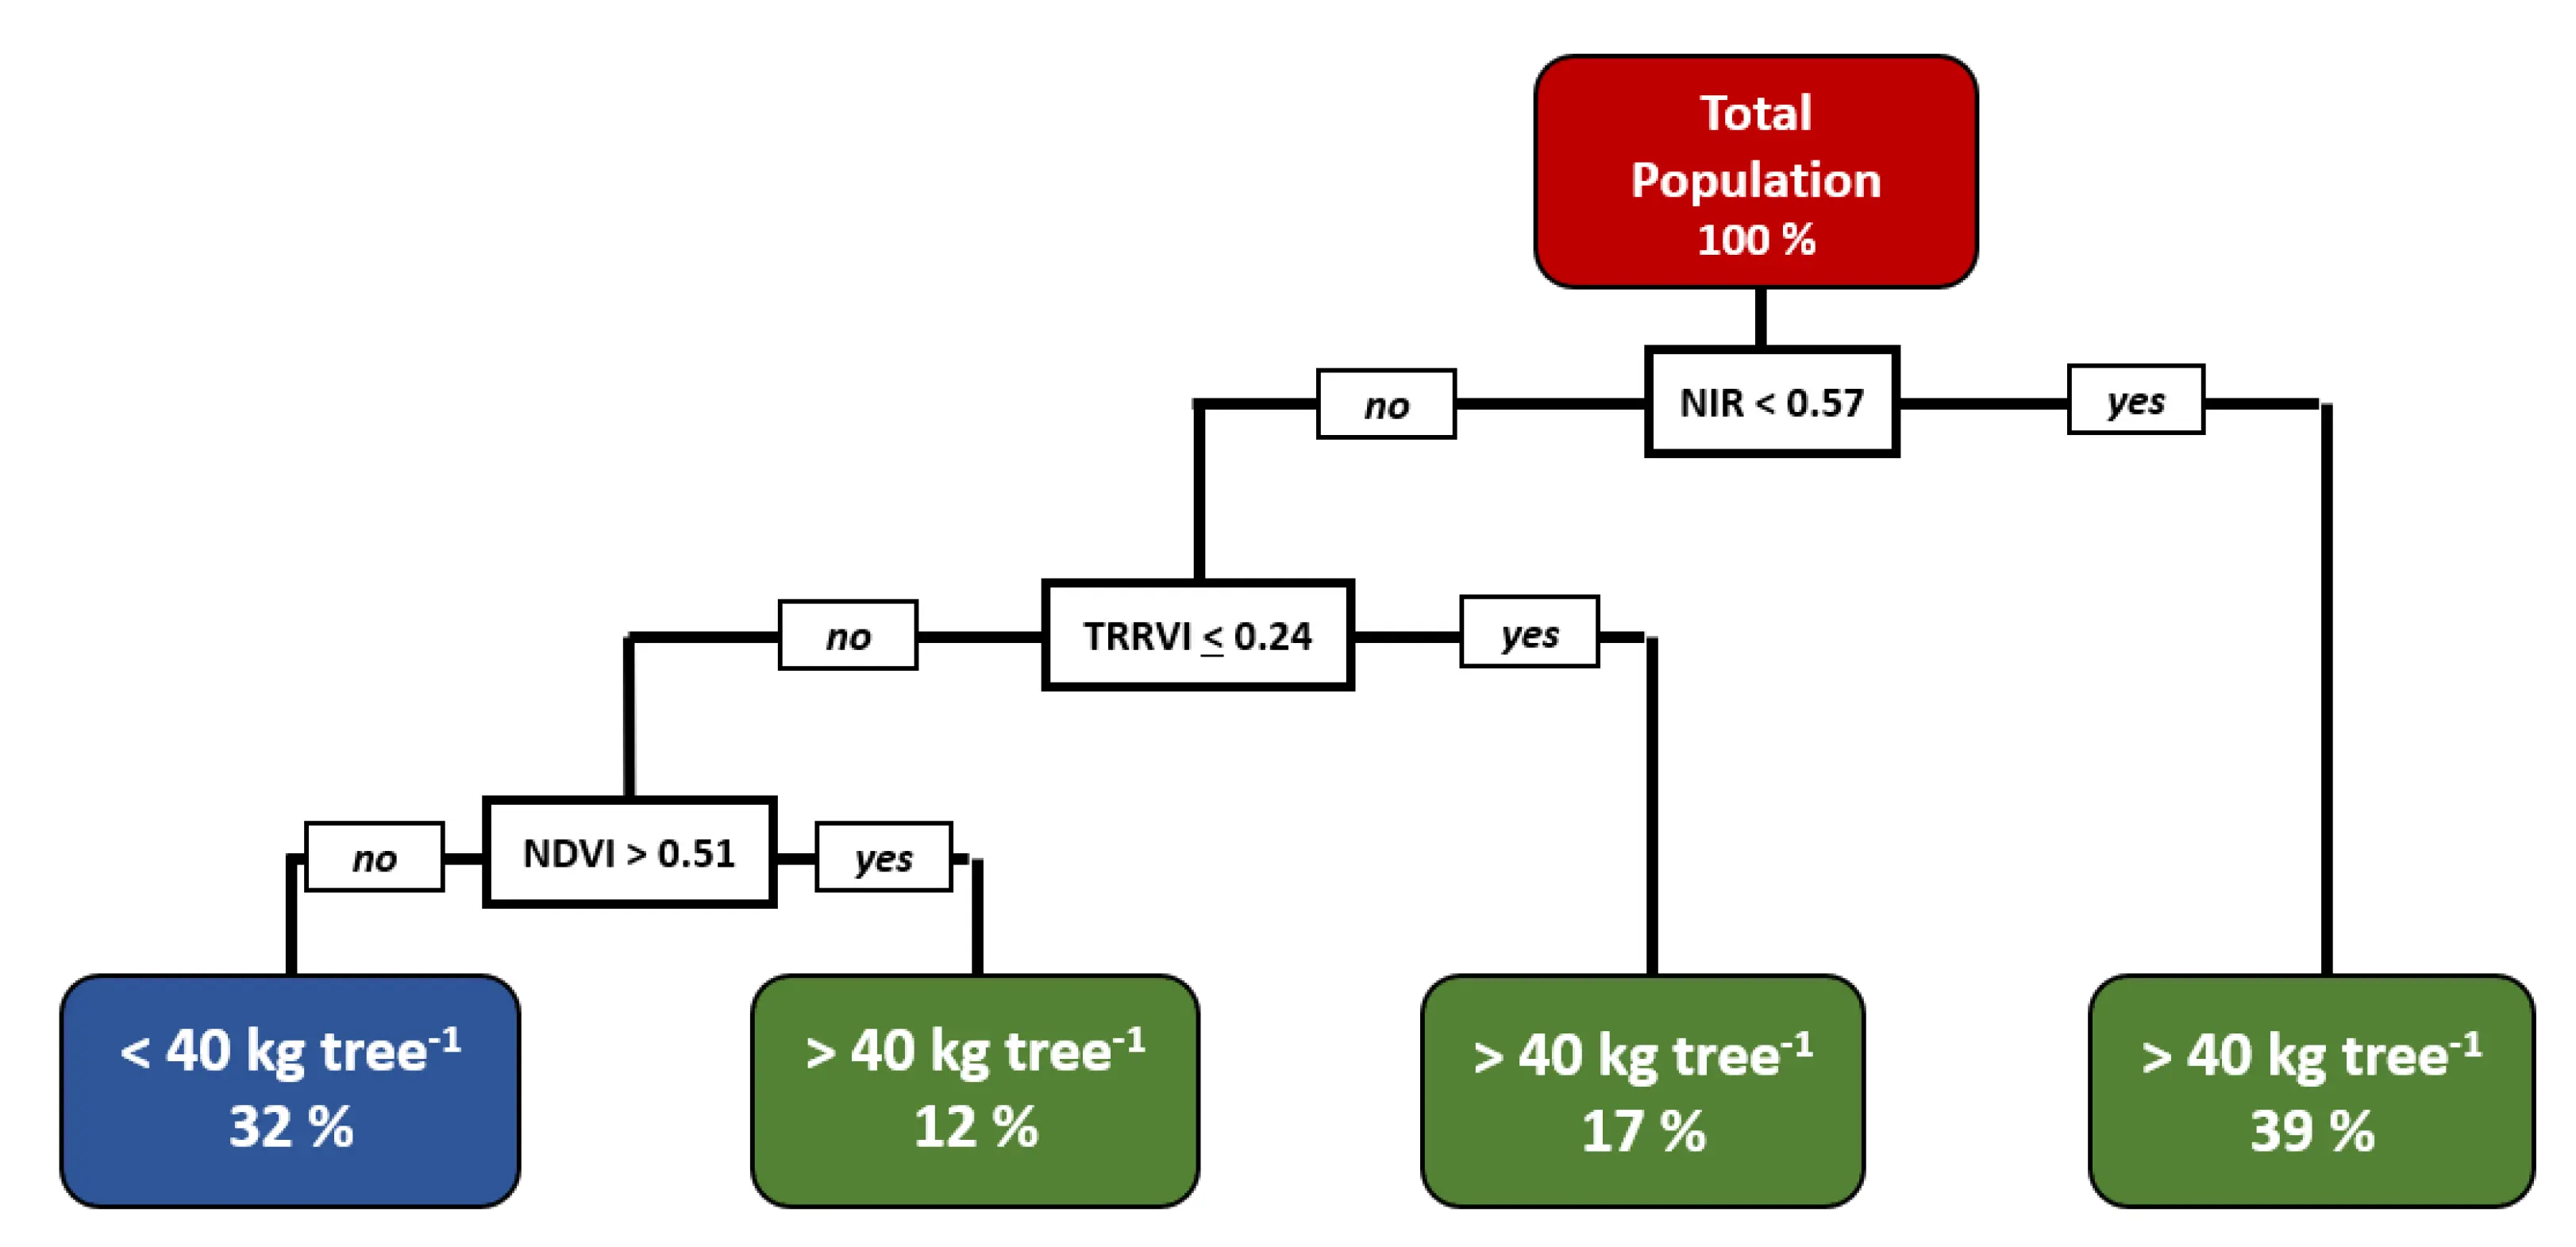 Figure 3. Decision tree analysis for sweet cherry trees classified according to their yield in two situations (higher and lower than 40 kg tree−1) considering mean preharvest value of tree’s NIR (near-infrared), TRRVI (transformed red range vegetation index), and NDVI (normalized difference vegetation index) computed in 2018 preharvest.
The objective of this study, conducted by the Polytechnic University of Cartagena and Londonderry Maps (Spain), is to assess the usefulness of five vegetation indices derived from multispectral images to observe the impact of deficit irrigation on the canopy structure of sweet cherries in the southeast of Spain.
The treatments applied were as follows: two regulated deficit irrigation treatments and a control treatment. Conventional water status indicators commonly used for managing sweet cherry irrigation, including midday stem water potential and maximum daily shrinkage, were measured and then compared with the results of the vegetation indices obtained through remote sensing.
This was made possible through four aerial flights conducted over two consecutive seasons. The relationships obtained through simple regression between the individual parameters were stronger in the post-harvest period than in the pre-harvest period.
Results and analysis
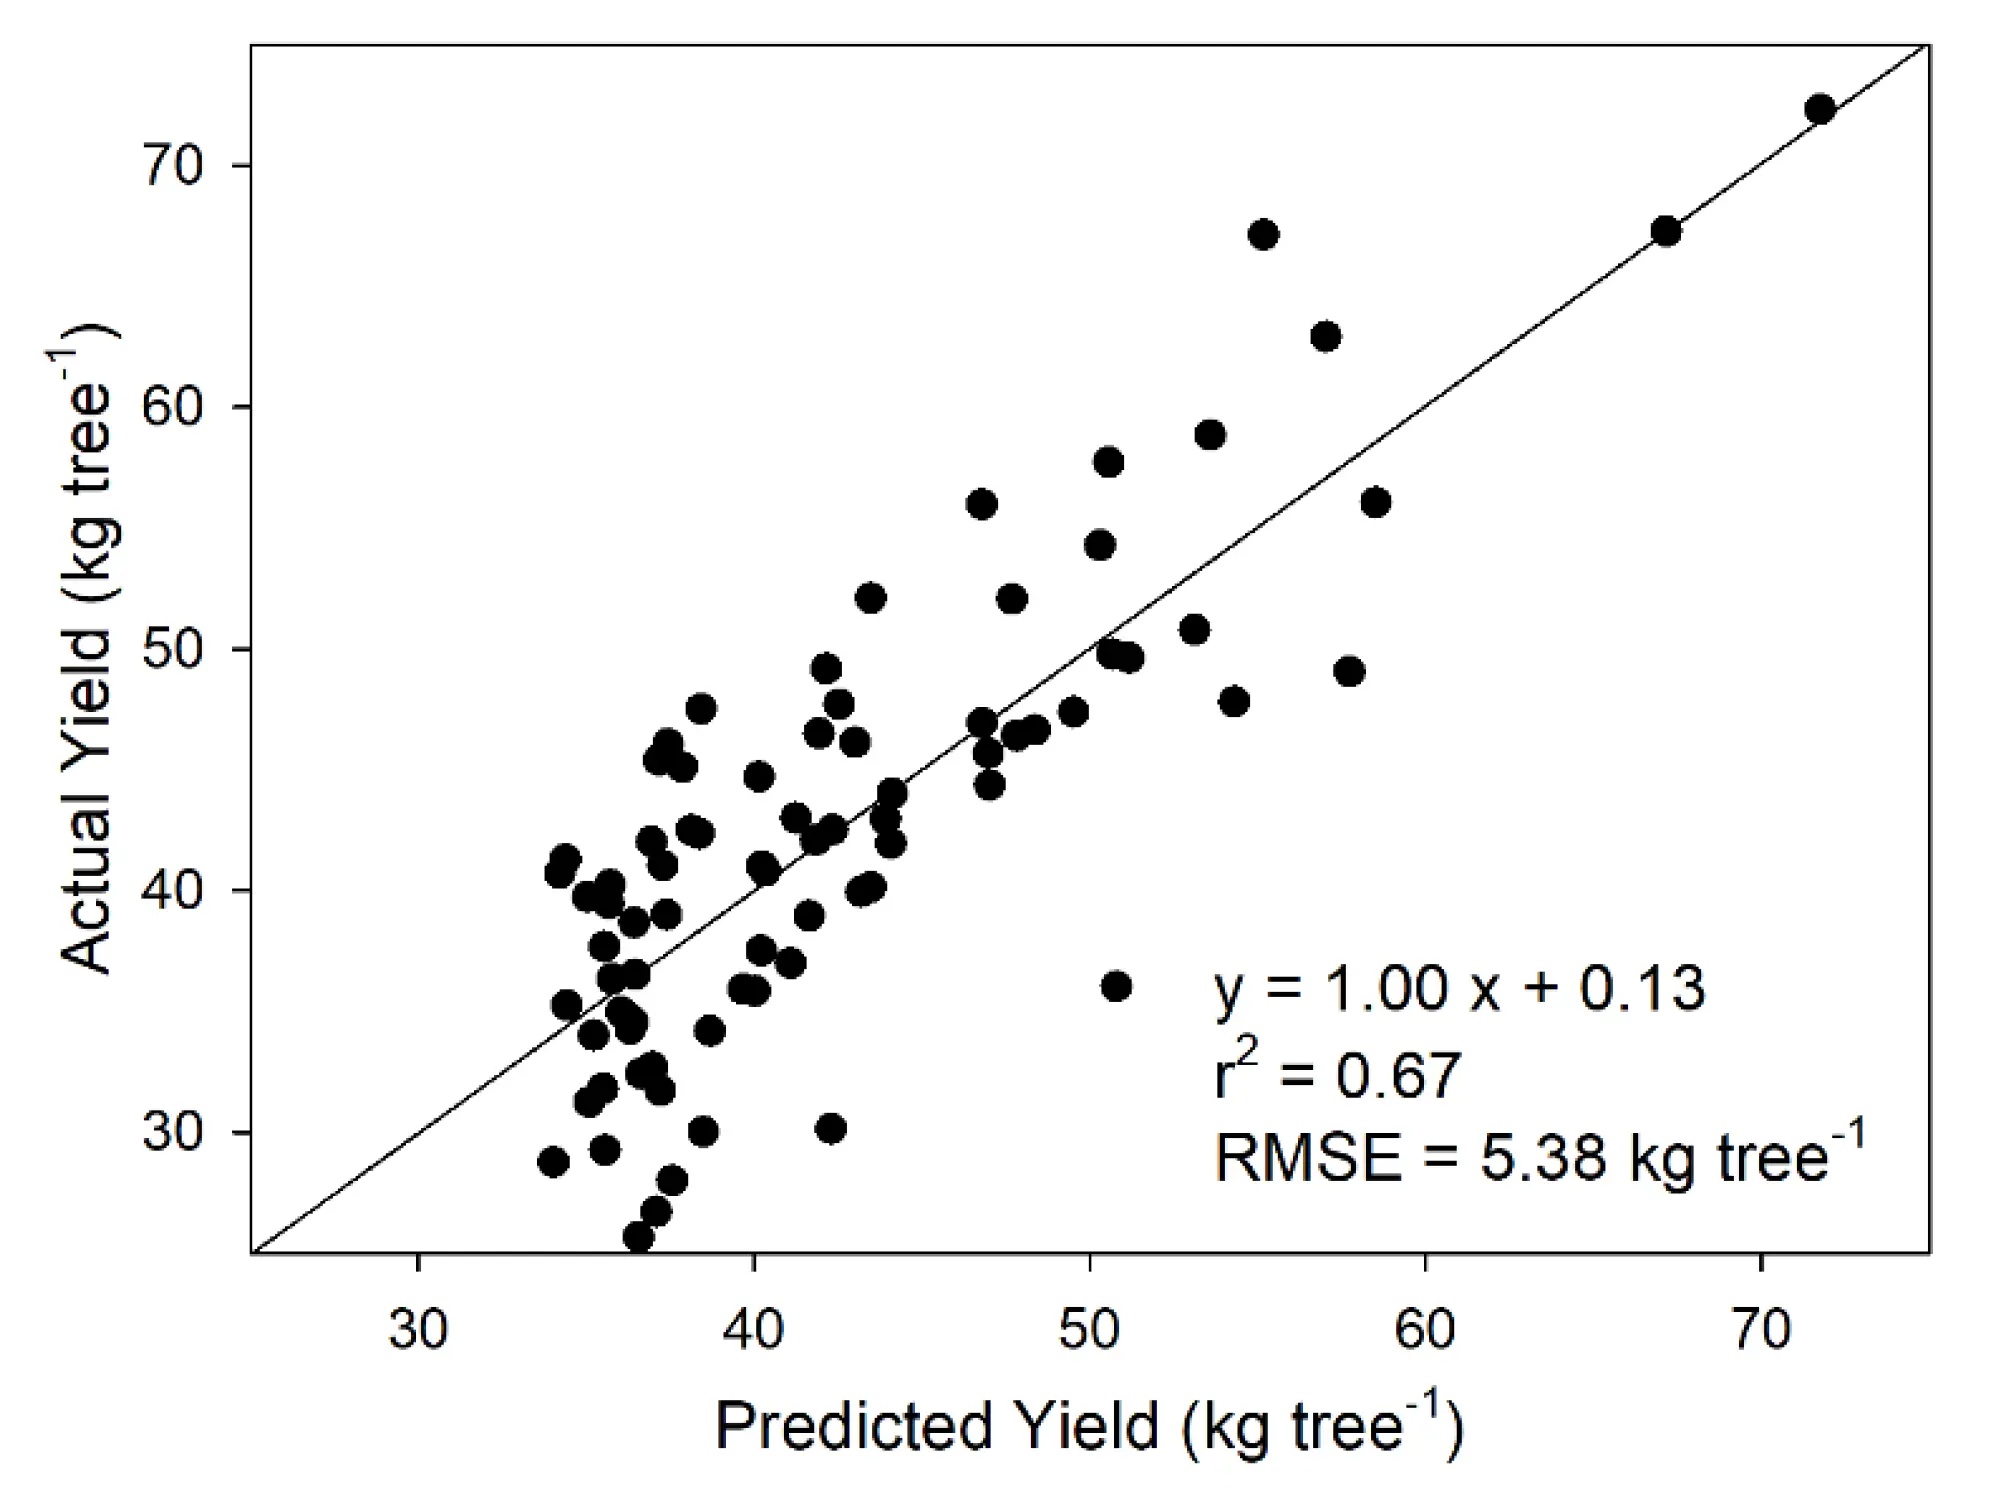 Figure 4. Regression equation obtained for the predicted and the actual yield of sweet cherry trees.
The normalized difference vegetation index (NDVI) showed the most significant correlation with stem water potential (R² = 0.67) and maximum daily shrinkage (R² = 0.45), followed by the NDRE index. Additionally, NDVI was the only index able to differentiate the trees subjected to the two different deficit irrigation regimes, resulting in the highest sensitivity.
Sensitivity analysis identified the optimized soil adjusted vegetation index (OSAVI) as the vegetation index with the highest coefficient of variation in post-harvest and the difference vegetation index (DVI) in pre-harvest.
Un nuovo indice promettente
Finally, the researchers propose the use of a new index, which was the only one able to statistically identify signs of mild water deficit appearing in the plants before harvest. This index is the transformed red range vegetation index (TRRVI).
Source: Blanco, V.; Blaya-Ros, P.J.; Castillo, C.; Soto-Vallés, F.; Torres-Sánchez, R.; Domingo, R. Potential of UAS-Based Remote Sensing for Estimating Tree Water Status and Yield in Sweet Cherry Trees. Remote Sens. 2020, 12, 2359. https://doi.org/10.3390/rs12152359
Source figure: Blanco et al., 2020
Melissa Venturi
University of Bologna
Cherry Times - All rights reserved