Significant first year observations:
- Boron leaf values were very high to toxic in 75% of the blocks sampled.
- Wide ranges of fruitlet nutrient values suggest that there are excesses and/or deficiencies in some blocks. Further work would be required to determine optimum nutrient ranges.
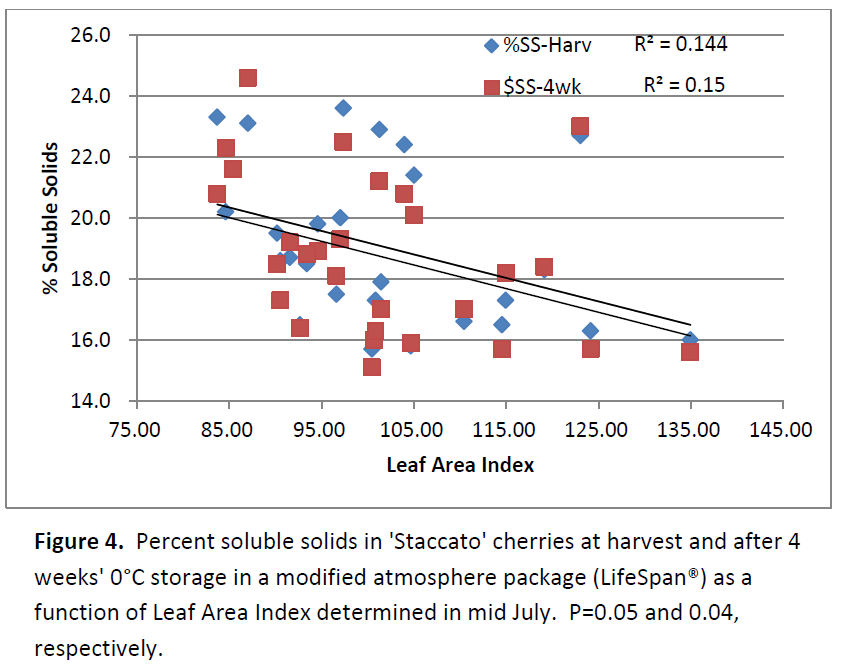
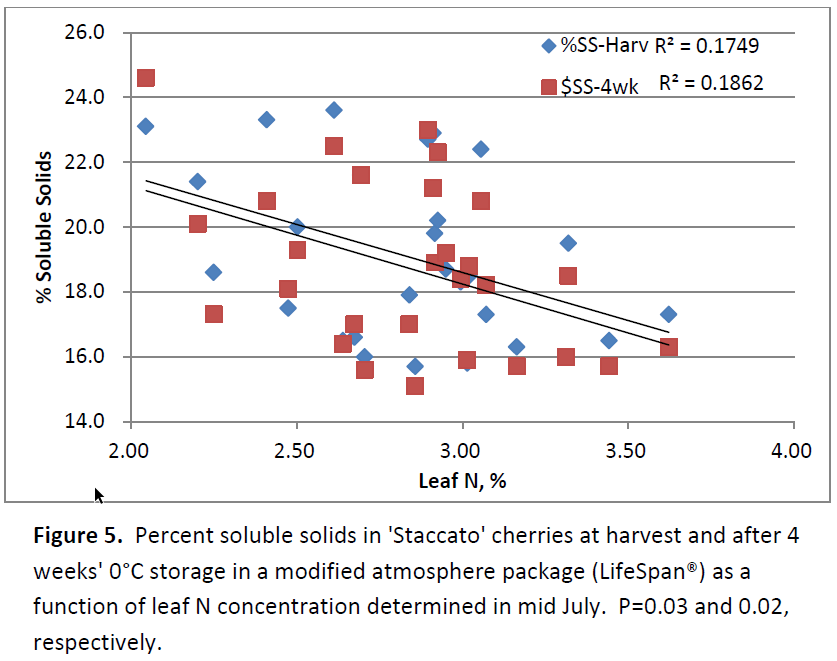
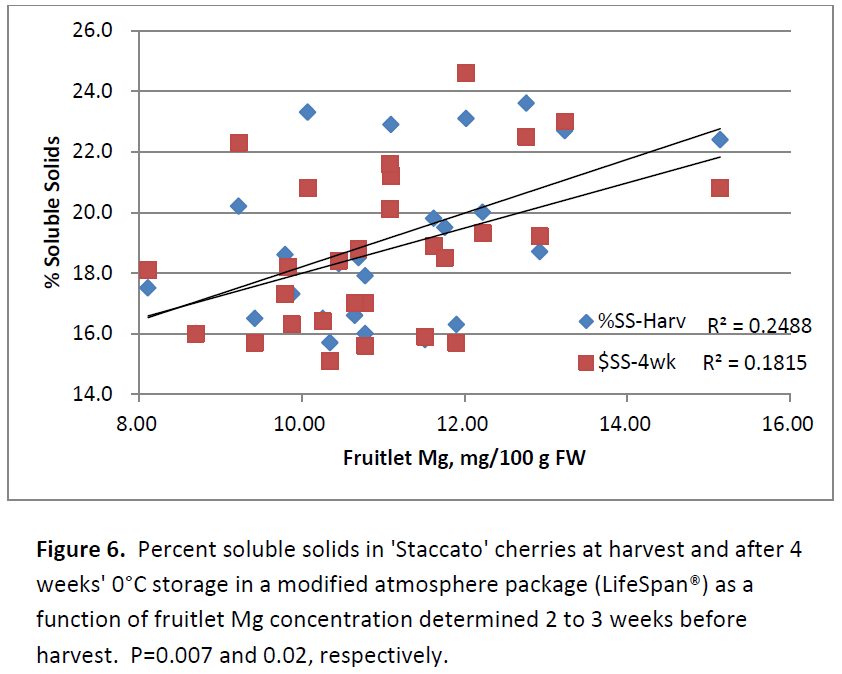
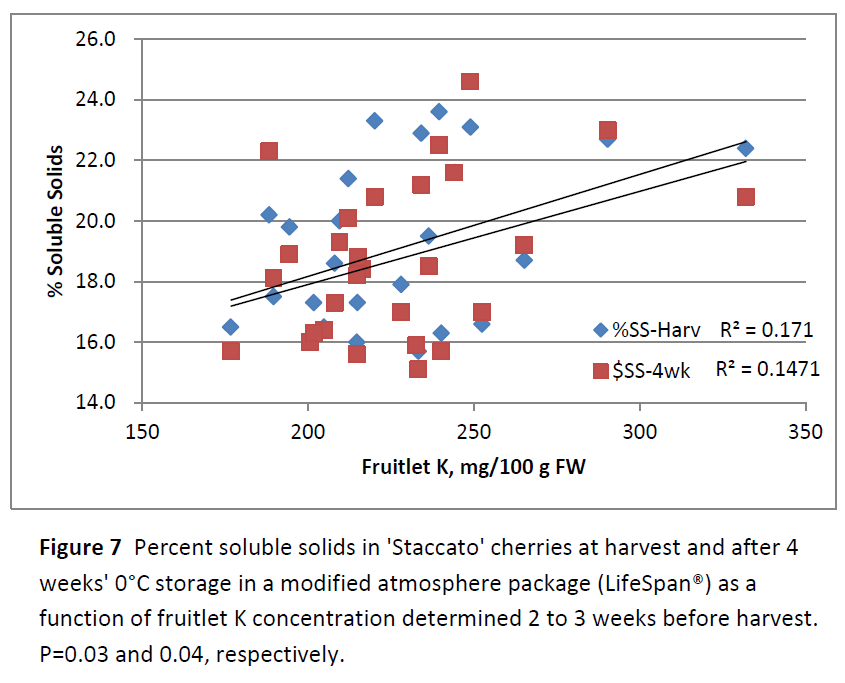
- Soluble solids were negatively correlated with leaf N and positively correlated with fruitlet Mg and K.
- Pitting was negatively correlated with firmness.
- Pebbling was negatively correlated with leaf Ca.
- Splits were positively correlated with fruitlet B.
Long distance shipping of refrigerated sweet cherry will create a demand for fruit with high storage quality. This will be particularly important for ‘Staccato’ which is susceptible to deterioration of quality in storage. It would be useful to determine if there are relationships between cherry fruit nutrient concentrations and key cherry quality measures.
This would provide nutritional targets for growers to produce cherries optimized for storage quality and also provide a method for allocating the ‘best’ fruit for refrigerated shipping. Currently, growers have little reliable information to determine which of the multitude of available nutritional spray programs will maximize cherry fruit quality.
Materials and methods
Thirty-two ‘Staccato’ blocks located in the Okanagan Valley of British Columbia representing a range of interior BC growing conditions were selected for the study. Thirty-one of the blocks were on Mazzard rootstock and one on Colt rootstock. Three trees of uniform vigour and crop load were labelled for the study in all blocks except one in which four trees were labelled because of light crop load.
In most blocks, sample trees were adjacent to one another. In a small number of blocks adjacent trees could not be located with uniform crop load. At these sites, sample trees were not more than three trees apart. All samples and measurements came from labelled trees. GPS coordinates of tree location were taken in each block.
Starting in mid June, after June drop, and continuing through early July in northern blocks, trunk diameter at 0.3 m above ground level was measured for calculation of trunk cross sectional area (TCSA) of sample trees. Crop load was estimated by measuring the diameter of one representative limb from each tree and counting the number of fruit above the diameter measurement location.
One week after the start of 'Lapins' harvest in the local area, a composite sample of 60 fruitlets was collected for mineral analysis from each block. This was estimated to be approximately two to three weeks before the start of 'Staccato' harvest. Fruits were collected from all parts of all sample trees in each block. Fruitlets were washed and stems and pits removed. Prepared fruitlet samples were then frozen for mineral analysis in the off-season.
At the same time that fruitlet samples were taken, a composite leaf sample consisting of 30 leaves, ten leaves per sample tree, was collected from mid-terminal, new year's shoot growth from each site. On the day of sample collection, leaf area index (LAI) was determined with a Li-COR Inc. LI3000A Portable Area Meter with a LI-3050A Belt Conveyor (Lincoln, NE). Leaf samples were then dried and stored for mineral analysis in the off-season.
At commercial harvest, a 9 kg composite sample of fruit was collected from each block (3 trees). Approximately equal amounts of fruit were picked from each sample tree. Fruit came from all parts of each tree. Mean fruit weight and firmness (FirmTech, BioWorks) were determined on a subsample of 50 fruits.
The same subsample was used to evaluate fruit for the quality parameters colour (CTIFL colour chart), stem browning, pitting, pebbling, splits, russet, powdery mildew and decay. Quality parameters were recorded both as percent of affected fruit and as a severity score.
For scoring, fruit were rated on a severity scale of 0 to 4 with 0 being no disorder and 4 being severe. Soluble solids were determined on a separate subsample of ten fruit. Approximately 8 kg of the remaining harvest sample was put into a modified atmosphere bag (LifeSpan®) and the bag then placed into an 18 lb bulk cherry box according to standard industry practice.
Samples were stored at 0 °C for 28 d and then evaluated as at harvest. Fruit used for post-storage firmness determination were held at room temperature for 4 h before testing. Stored fruitlet and leaf samples were analyzed for standard nutrients in the off season. N was determined by LECO combustion and P, Ca, Mg, K, B, Mn, Zn, Fe and Cu by inductively coupled emission spectroscopy (ICP).
Data were analyzed by linear regression analysis. All measured fruit characteristics were regressed against all leaf and fruitlet minerals, LAI, crop load, fruit weight, colour, fruit firmness and soluble solids. Significant regressions (P≤0.05) were plotted and reviewed. In all cases where significance depended on a single outlier observation, the relationship was eliminated from further consideration. Plots of the remaining significant correlations are presented and discussed below.
Results and discussion
A total of 28 harvest samples were collected from the 32 blocks originally selected for leaf and fruitlet analysis. Four blocks were harvested earlier than anticipated and no fruit was available for storage samples from those orchards. Results presented here are from the 28 blocks for which there are complete data sets.
Leaf analyses
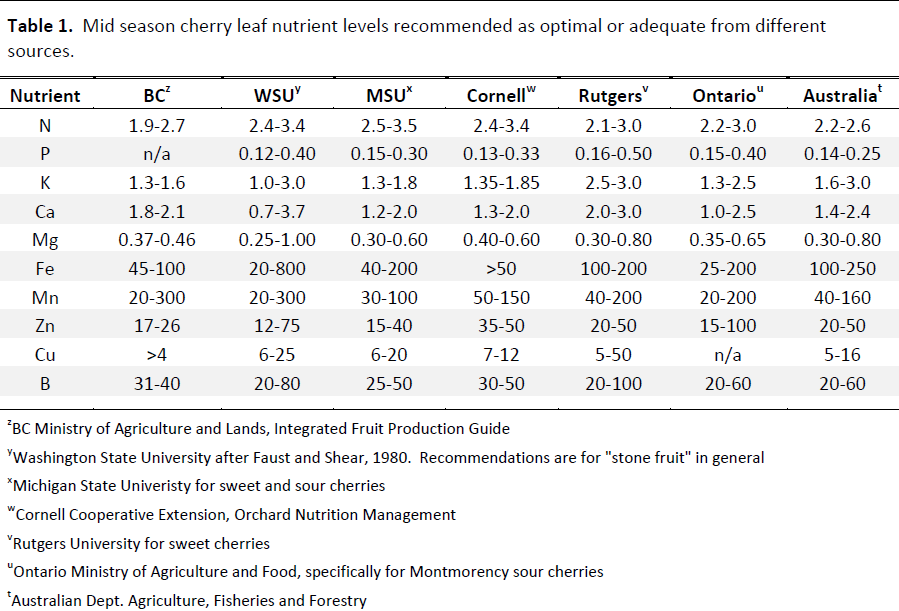
A survey of cherry leaf analysis recommendations from a number of cherry producing regions shows that the range of nutrient values considered optimal or adequate for mid season leaf sampling is varied (Table 1). The reasons for these differences are not known although in the case of Washington State, the recommendations are for all stone fruits which presumably could expand their range.
Using the most common ranges in Table 1 as a base, leaf analysis results in our 2014 survey were categorized as Low, Optimum and High (plus Very High and Toxic for boron) (Table 2).
Most blocks were in the Optimum range for leaf N, Mg, Mn, Fe and Cu. Leaf Ca was low in 71% of the blocks. In apple, vigourous growth can dilute leaf Ca which might account for at least some of the low observations here. There was a wide range of leaf Zn though it tended to the low side with 43% of samples ranked Low. Boron, P and K were skewed toward High rankings.
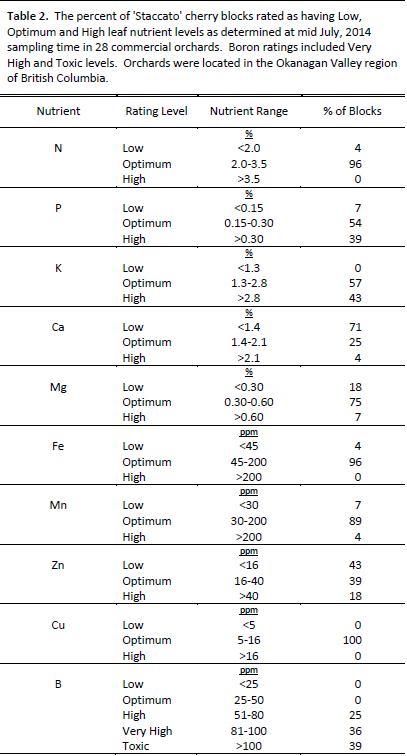
Leaf B values in the survey were unexpectedly high with 75% of all samples >80 ppm, 39% >100 ppm and 18% ≥115 ppm. Several sources categorize >80 ppm as being potentially toxic in sweet cherries. Other authorities' optimum values extend up to 100 ppm.
Establishing optimum ranges for leaf minerals is, to a great extent, a subjective exercise in which signs of nutrient deficiency or excess in leaves and observations on overall tree health are compared with the results of tissue analyses.
In a survey of Okanagan peach orchards in the early 1980s, Neilsen et al. (1985) found symptoms of B toxicity in trees with leaf B levels within the range of what was considered to be acceptable at the time (20-80 ppm). They recommended revising the range to 26-50 ppm.
Boron toxicity symptoms in cherries can include brown spotting on the underside midrib of leaves, cankers on young twigs and petioles, misshapen fruit, yellow leaves, leaf drop, tip dieback and gumming (Strand, 1999). Using foliar Solubor applications, Bolwyn (1967) was able to induce severe B toxicity in 'Royal Anne' cherries.
In that study, treated spur leaf B levels reached 129 ppm compared to untreated controls at 48 ppm. Unfortunately, there was only one level of B applied and so there were no intermediate values of B between the controls and treated leaves that would give a better indication of the value of foliar B at which less severe toxicity symptoms might become visible.
The orchards used in our 2014 survey represent a wide range of soils and management practices yet almost all had very high leaf B values. It would be prudent to further investigate the reasons for B values observed in this survey.
Fruitlet analyses
The range of nutrient concentrations found in 'Staccato' cherry fruitlets varied widely (Table 3). Boron and Cu concentrations each varied by more than four-fold from the high to low observations while fruitlet N varied by 3.6 times.
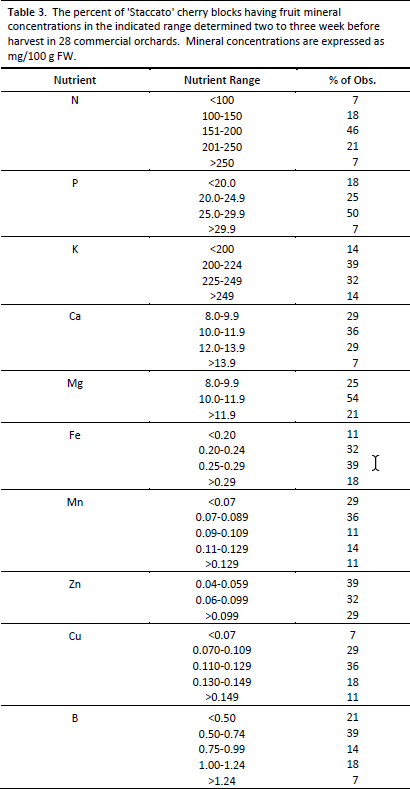
The least variation was seen in fruitlet Mg and K, each with a ratio of 1.9 from the highest to lowest observations. Variations of these magnitudes are not unusual in apple fruitlets and are generally similar for the specific nutrients. As with apples, ranges of two, three and four-fold suggest that there must be instances of excess and/or deficiency represented in the population.
Leaf vs. fruitlet nutrient correlations
The correlation coefficients for the linear regressions of nutrients in 'Staccato' leaf and fruitlet samples are presented in Table 4 along with values for the same correlations in three apple cultivars for comparison. Potassium and B were the only two 'Staccato' nutrients for which concentrations of leaf and fruitlet nutrients were not significantly correlated.
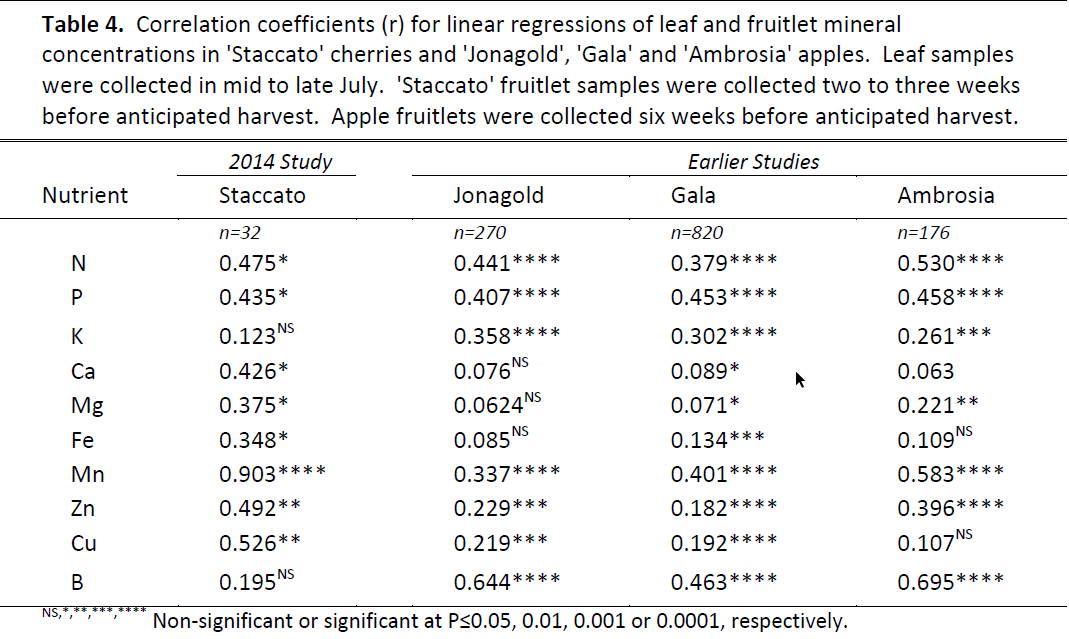
Leaf vs. fruitlet mineral correlations for Mn, N, P in 'Staccato' were similar to those for apples. 'Staccato' leaf vs. fruitlet correlations for Ca, Mg and Fe were all significant at P≤0.05 while in apples these correlations are generally non-significant. Conversely, in apples, leaf and fruitlet B are strongly enough correlated where leaf B can be reasonably used to estimate fruitlet B but this was not the case with 'Staccato' samples in 2014.
Leaf and fruitlet correlations with fruit quality parameters
Red colour was negatively correlated with leaf B and K and with fruit weight (Figs. 1-3). There is no obvious rationale to explain these results. Potassium is generally associated with increased red colour in apples fruits (Boynton, 1954).
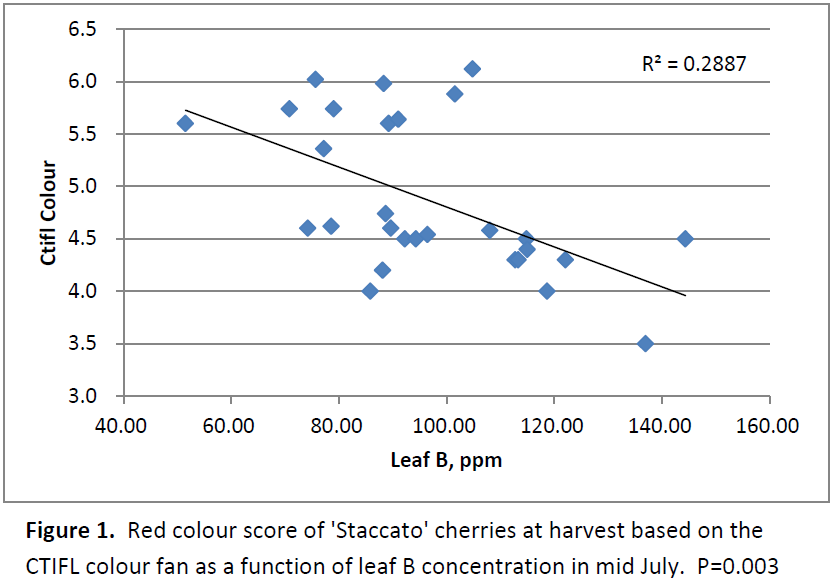
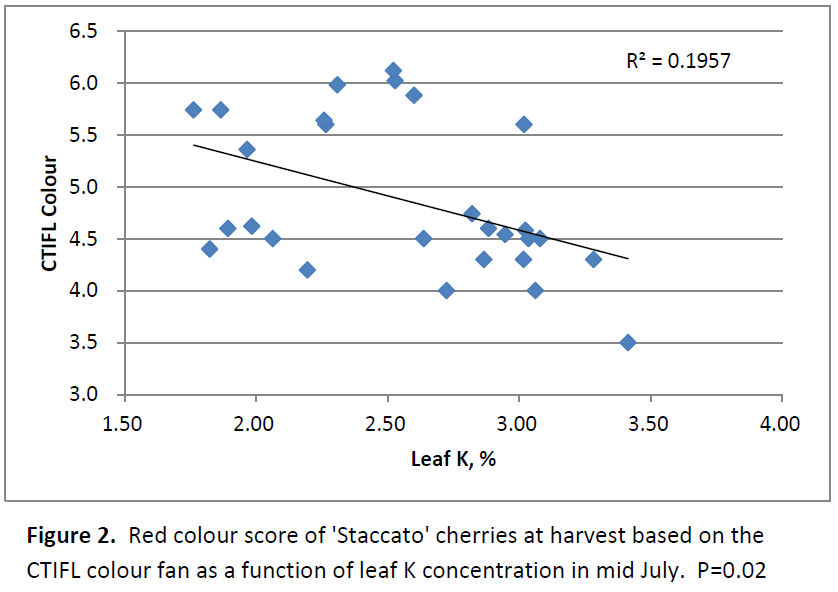
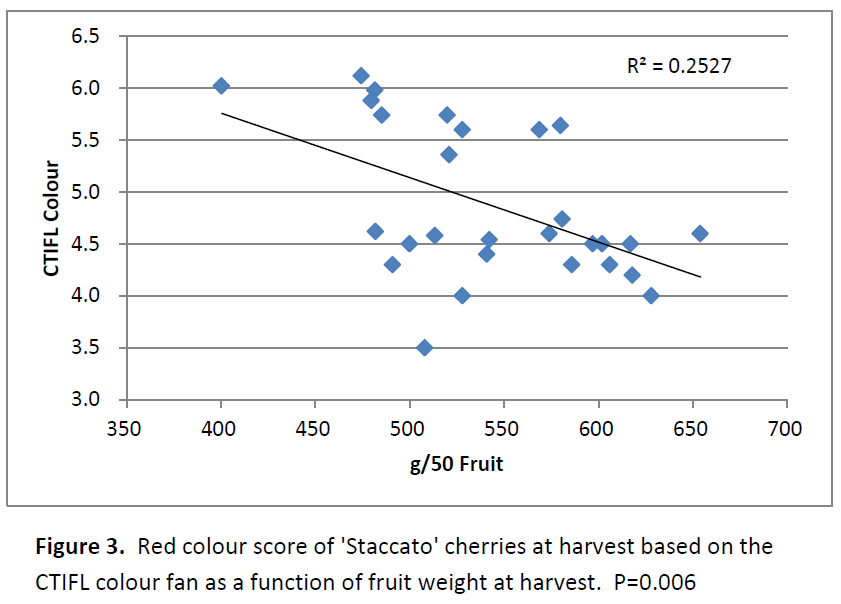
Most colour change associated with K in apples occurs when K is increased from deficiency to sufficiency, not from sufficiency to excess. Leaf and fruitlet K were positively correlated with red colour in 'Jonagold' and 'Spartan' apples in the BC apple industry's fruitlet program.
Soluble solids were negatively correlated with the LAI and leaf N and were positively correlated with fruitlet Mg and K (Figs. 4-7). The negative correlation of leaf N with soluble solids was similar to that found by Fallahi et al. (1993) in 'Bing' cherries. Fruitlet N was not significantly correlated with soluble solids. Neilsen et al. (2004) reported a significant, positive correlation between cherry fruitlet N and soluble solids.
The percent of fruit with stem browning and the stem browning score were positively correlated with soluble solids at harvest (Fig. 8). Soluble solids increase steadily in the period immediately preceding and through harvest (Neilsen et al., 2004; Lau et al., 2005).
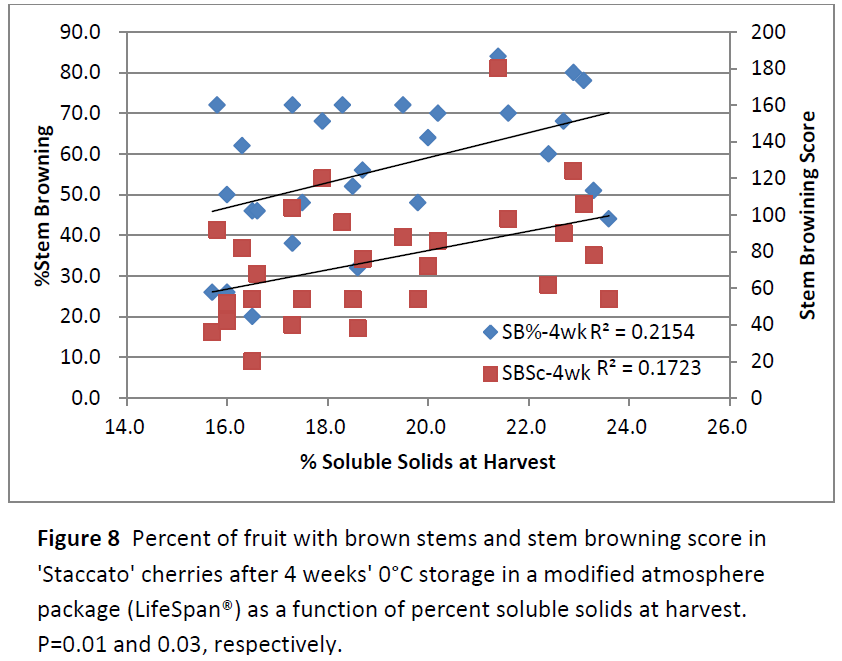
While neither soluble solids nor stem browning are indicative of harvest maturity, later harvested 'Lapins' had more stem browning than earlier harvested fruit. Thus, while soluble solids are not a direct measure of absolute cherry maturity (Lau, et al., 2005), higher levels of soluble solids might be indicative of generally more advanced maturity which, in turn, could account for more stem browning.
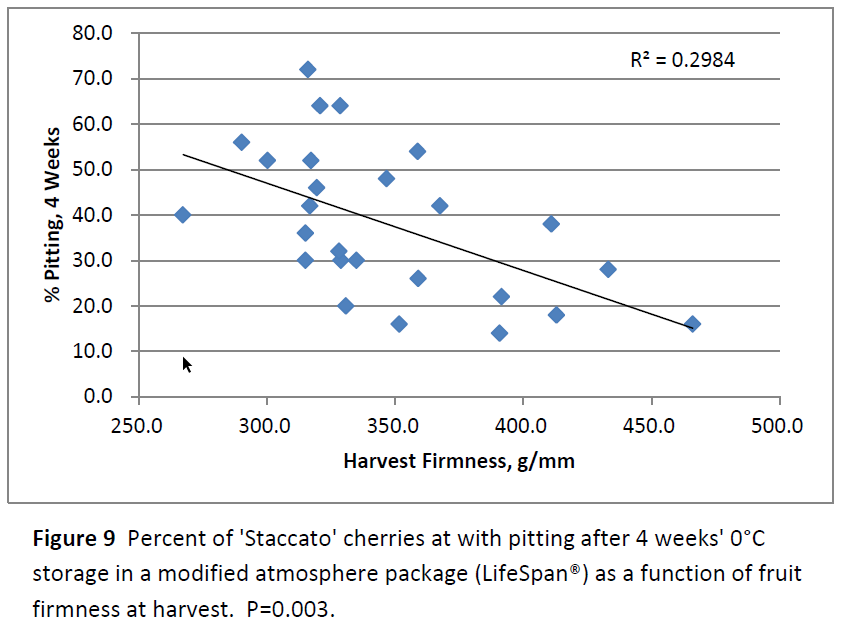
The percent of fruit with pitting after 4 weeks' storage was negatively correlated with harvest firmness (Fig. 9). The relationship between pitting and firmness has long been recognized (Patten, et al., 1983). Pitting arises from compression and impact damage incurred during harvesting, handling and packing. Firmer fruit is more resistant to such damage.
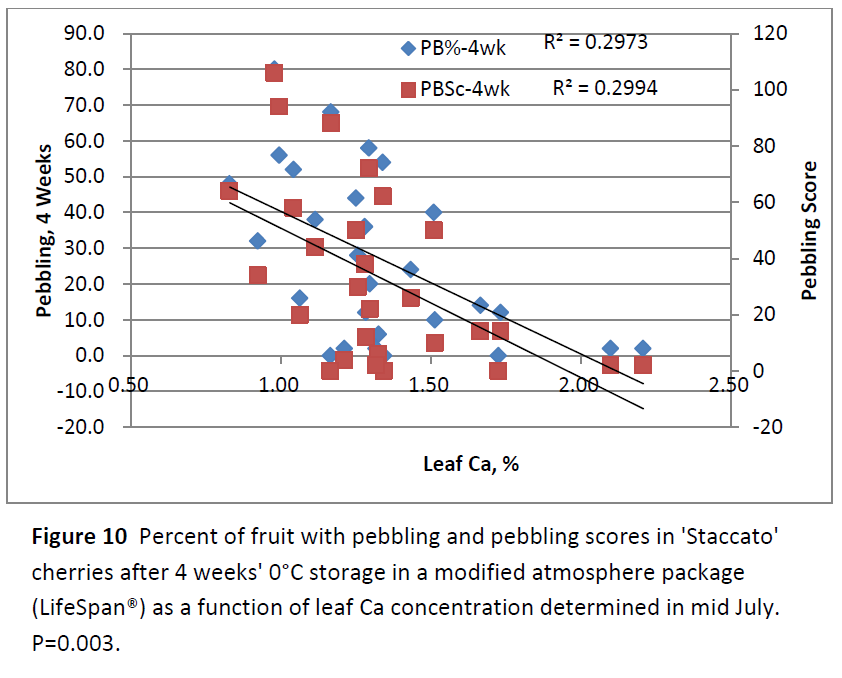
Cherry pebbling was negatively correlated with leaf Ca (Fig. 10). Significant correlations of fruit quality parameters with leaf minerals are not common, especially when the relationship with the same mineral in the fruit is not well correlated. The correlation of fruit Ca with pebbling was negative with P=0.18. Additional years’ data would be required to determine whether or not the relationship is consistently repeated.
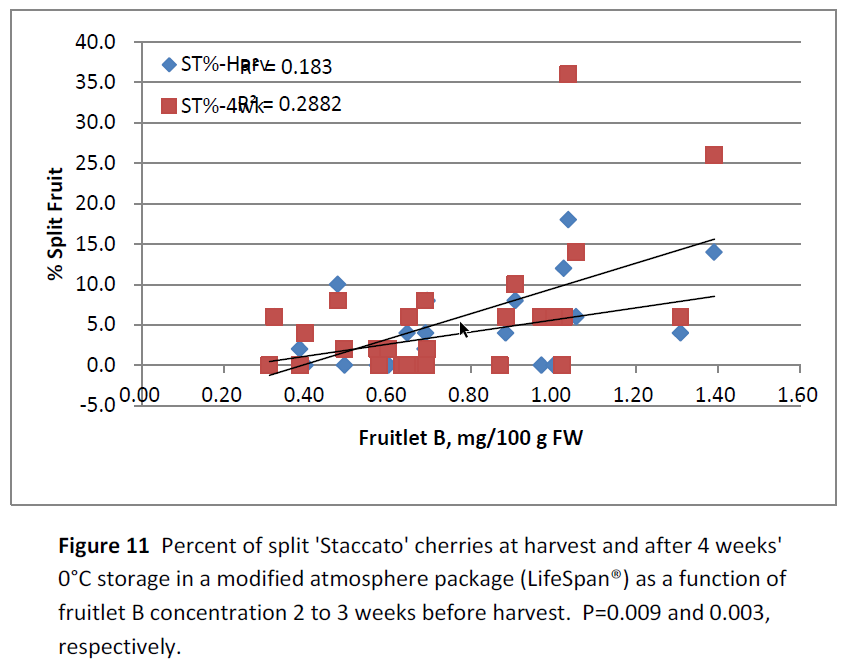
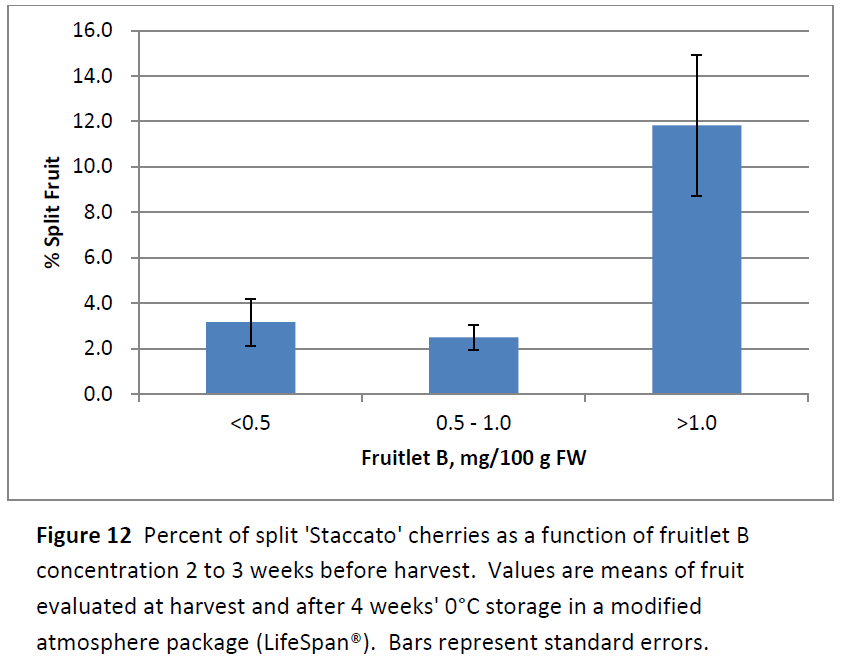
Cherry splitting was positively correlated with fruitlet B (Fig. 11). Fruit with B concentrations ≤1.0 mg/100 g FW averaged less than 3% splits while those with >1.0 mg/100 g FW averaged almost 12% splits (Fig. 12).
The tolerance of plant tissues to higher levels of B varies widely (Marschner, 1995). Peryea (1994) gives values for excessive levels of B for apricot and peach fruit as 200 ppm dry wt and 60 ppm dry wt, respectively. If fruit is assumed to be 15% dry weight, the apricot and peach values would convert to approximately 3.0 and 0.9 mg/100 g FW, respectively.
Thus, two very closely related fruits can differ greatly in their tolerance of B. Even the lower value of 0.9 mg/100 g FW is high when compared to apples where values >0.5 are a cause for concern.
Boron toxicity symptoms for apricots, peaches and cherries are reported as reduced or no yields, malformation, poor pit development, early maturation and poor flavour (Peryea, 1994). High B induces apples to ripen early and, subsequently, store poorly. Apples, apricots and peaches are all climacteric fruit in which ripening is a very specifically defined and measurable set of processes. Such is not the case with cherries.
Cherries are not climacteric and are harvested at a point in their ongoing development when colour, firmness and soluble solids are considered optimum for a given marketing plan. Boron induced early maturation in 'Gala' apples frequently results in significant levels of stem bowl splitting.
Although the way in which high B induces early ripening in climacteric fruit is not understood, the process of stem bowl splitting in 'Gala' apples of advanced maturity has been described in detail (Andrews et al., 1999). While it might be tempting to draw parallels between splitting in high B 'Staccato' cherries and 'Gala' apples, caution is advised without further work.
Cherries and apples have fundamentally different physiologies leading to maturation and, while B has been shown to have an effect on apple maturation, no such effect has been demonstrated on cherries. Further, the relationship between fruit tissue B and splitting in 'Gala' is well established but has only been observed in this single instance with 'Staccato' cherries.
Firmness at harvest was positively correlated with firmness after four weeks' storage (Fig. 13).
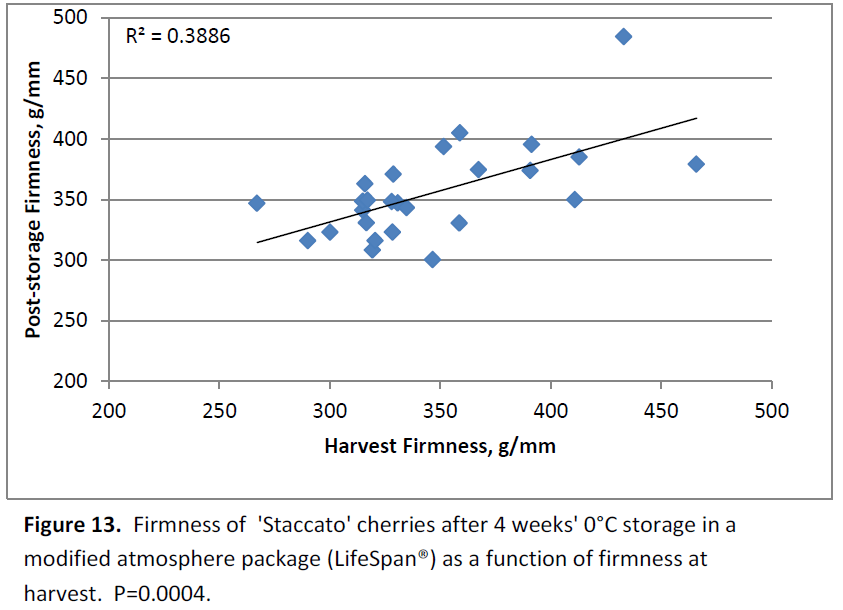
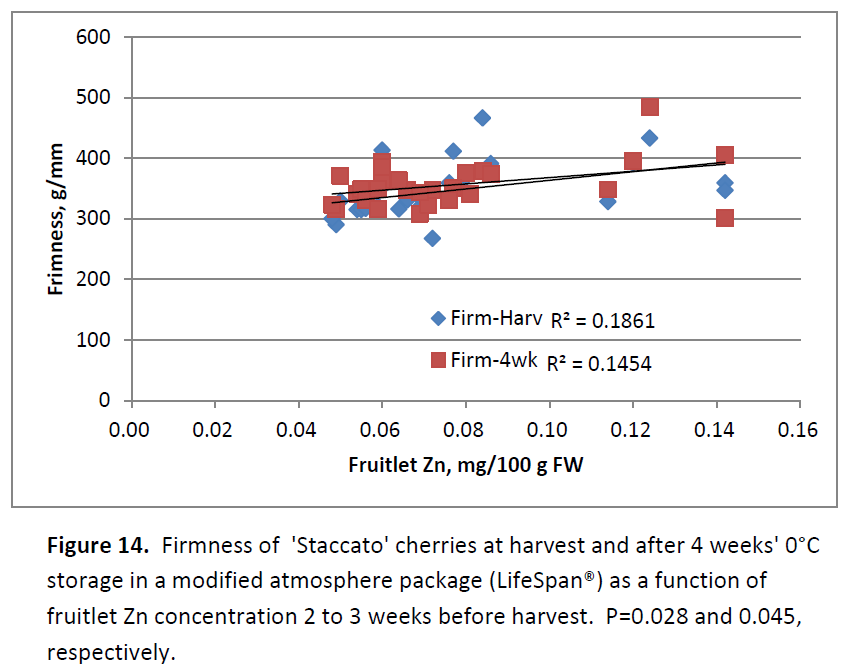
As with apples, the best predictor of cherry firmness coming out of storage is firmness going into storage. Firmness at harvest and after four weeks' storage was positively correlated with fruitlet Zn (Fig. 14). Significance of the relationship is somewhat dependent on a small number of observations with higher levels of Zn which would be a reason to interpret the results with caution. Additional years of data would be necessary to determine if fruitlet Zn is really related to fruit firmness.
In the 2004 nutrition study funded by the Cherry Association on 'Santina', 'Bing', 'Lapins' and 'Sweetheart' cherries, fruit firmness was significantly correlated with fruit Ca, Mg (both positive) and P (negative). In 2014, none of these correlations was significant.
However, if two outlier P samples were dropped from the 2014 dataset, P was negatively correlated with harvest firmness at P=0.10. There is no particular rationale that would explain why higher concentrations of P would lead to softer fruit. In apples, higher P is clearly associated with firmer fruit.
The practice of fruitlet mineral analysis looks for potential relationships between nutrients and fruit quality by correlating the results of leaf and fruitlet mineral analyses with postharvest fruit quality parameters. This is often referred to as data mining. It is not the same as performing a controlled experiment where the statistical probability of treatment effects can be determined.
Statistical significance in linear regression simply indicates the probability with which the values of one variable change relative to another. It does not imply an effect of one on the other. It is only after an observed relationship has been consistently significant over a period of several crop years that we can begin to have confidence in its worth as a tool for predicting some aspect of fruit quality and using the relationship as a guide in a grower's nutrition program.
There were several observations that would support the continuation of this project at sometime in the future. In general, the wide ranges of fruitlet mineral concentrations in our first year's data suggest that there are possible deficiencies and/or excesses. Deficiencies and excesses can directly reduce yields and fruit quality and are a threat to tree health.
Additionally, excesses, even when they do not have a negative effect on production, are a wasted economic input. High leaf N was associated with lower fruit soluble solids. The negative correlation between leaf Ca and fruit pebbling is questionable simply because leaf minerals are not frequently well correlated with fruit quality but, nonetheless, it would be worthwhile to determine if the relationship is consistent.
The observation that the incidence of split cherries was greater in fruit with higher levels of B would also warrant further work. The negative correlation of fruit P with firmness observed in 2004 was hinted at in the 2014 data, though not statistically as strong.
Finally, although not directly the focus of this study, the extremely high levels of leaf B found in a high percent of the orchards sampled, bears further investigation as to why the levels are so high and whether or not there are any observable negative consequences.
Source: Bill Wolk, BC Tree Fruits Cooperative, Kelowna, BC; Gayle Krahn, Jealous Fruits, Lake Country, BC; Duane Holder FarmQuest Consulting, Creston, BC; Gerry Neilsen and Lana Fukumoto, PARC-Summerland, Agriculture and Agri-Food Research Centre, Summerland BC, "Determination of the relationship between 'Staccato' cherry fruit storage quality and mineral nutrition: 2014 field study".
Images: SL Fruit Service; Bill Wolk, BC Tree Fruits Cooperative, Kelowna, BC; Gayle Krahn, Jealous Fruits, Lake Country, BC; Duane Holder FarmQuest Consulting, Creston, BC; Gerry Neilsen and Lana Fukumoto, PARC-Summerland, Agriculture and Agri-Food Research Centre, Summerland BC.
Bill Wolk, BC Tree Fruits Cooperative, Kelowna, BC; Gayle Krahn, Jealous Fruits, Lake Country, BC; Duane Holder FarmQuest Consulting, Creston, BC; Gerry Neilsen and Lana Fukumoto,
PARC-Summerland, Agriculture and Agri-Food Research Centre, Summerland BC
Cherry Times - All rights reserved


