In the long term, we are expected to face summers with increasingly extreme weather conditions, with longer, more intense, and more frequent heatwaves; and record-breaking temperatures, like those recorded this year.
Unfortunately, in Chilean conditions, these periods of excessive heat coincide with the post-harvest phase of cherry trees, when two fundamental processes for the production of fruit in the following season occur: the accumulation of reserves and flower differentiation.
In addition to the scorching conditions of this summer, “in the summer of 2023, weather conditions prevailed that were highly stressful for the crop, with average maximum temperatures exceeding 30°C until well into March. Such climatic conditions affected the proper process of flower bud differentiation as well as the accumulation of reserves for the season,” warns consultant Luis Espíndola.
However, 2023 was not the first summer with these conditions. “In the 2019/20 season, we had a record 219,500 stress units (Figure 3), reaching an accumulation 35% higher than the historical average. In the 2022/23 season, we accumulated around 200,000 stress units, very similar to the 2019/20 season,” the expert points out.
Maximum temperatures were abnormally high. “Average maximum temperatures in 2022/23 were much higher compared to other seasons, but they were especially recorded until April and even May, when typically the highest temperatures occur in December and January.
This is a condition that significantly affects the entire process of shoot formation and reserve accumulation for the next season,” the consultant warns. The stress unit is a measure characterized by low relative humidity and high temperature. It is calculated using the following formula.
Stress unit = (T° - 10) x (-0.2 x RH + 15)
Relative humidity ≤ 75% and temperature ≥ 10ºC
“Figure 4 shows the monthly accumulation of stress for six seasons, and it is clearly noticeable that in the January-March 2023 period, stress accumulation was very high compared to the average (yellow). While the 2019/20 season almost reached 220,000 stress units, 35% more than the historical average (162,827), stress accumulation was very high during the January-March 2023 period.
In the 2022/23 season, we had a stress accumulation that exceeded the average by almost 21%,” says Espíndola.
The summer of 2023 saw many hours with temperatures above 29°C, especially compared to the previous season, when temperatures were much more moderate. Although the 2019/20 season was characterized by high temperatures, they were not as high as last year.
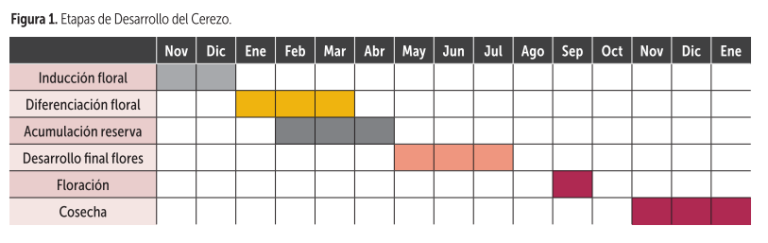 Image 1: Cherry tree development periods.
Table 2 shows various climate parameters for the January-April periods of 2021/22 and 2022/23, where some blocks of high evapotranspiration (ET0) stand out, even exceeding 43 mm per week in 2023. “We also see very high maximum temperatures, especially starting from mid-February, which continued into March. Even the averages of maximums were higher than in other seasons, especially when compared to the previous year.
Observing the accumulation of hours above 30°C, there are blocks of enormous stress due to very high temperatures,” the consultant highlights.
From January 1 to April 2 of the 2022/23 season, 279 hours were accumulated with temperatures above 30°C, compared to only 140 hours in the previous season.
“Clearly, the 2022/23 season was characterized by high temperatures, with cycles of intense heat, which unfortunately can be problematic because they affect the crop's biological processes that will impact the following season, as high temperatures were recorded when flower bud primordia for the next year were forming,” states Espíndola.
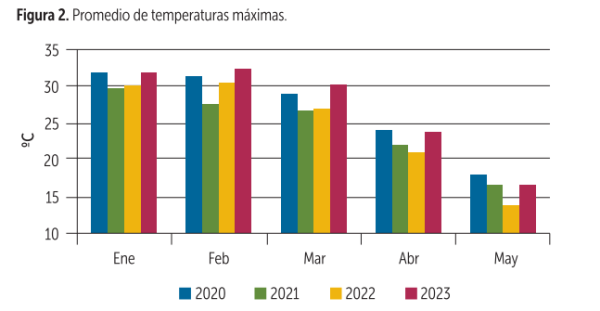 Image 2: Average maximum temperatures.
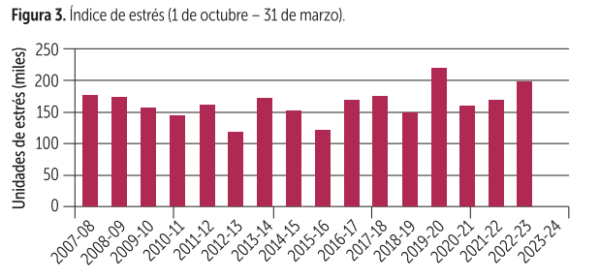 Image 3: Stress index (from October 1 to March 31).
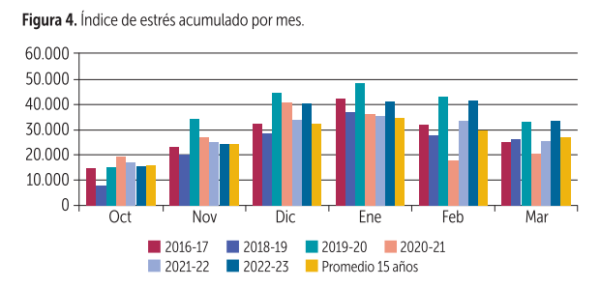 Image 4: Monthly accumulated stress index.
Paradormancy, the first stage of dormancy
After flower differentiation and reserve accumulation, the dormancy or winter recession period begins, which is divided into three phases. The first phase, known as paradormancy, begins when temperatures drop, days shorten, and 50% leaf fall is reached before moving on to endodormancy. This second phase requires low temperatures for the plant to accumulate the necessary cold to break dormancy.
Once the necessary cold has accumulated, a requirement that depends on the combination of variety and rootstock, the plant becomes receptive to warmth. The third phase is known as ecodormancy, when the process becomes solely dependent on external temperatures.
“Paradormancy usually starts in May, although exceptionally, it may begin in April; in this phase, the acclimation process is crucial for the shoots to withstand low winter temperatures. A bud with poorly closed scales cannot withstand low winter temperatures.
“When we are faced with high-temperature conditions or excessive fertilization, among other factors, the plant will enter recession late, leaving it exposed to various disadvantages,” the expert emphasizes. Since green tissues cannot withstand temperatures below zero degrees Celsius, the dormant plant prevents the buds from sprouting even during periods of higher winter temperatures.
| Table 1. Hours with temperature >29°C. |
|---|
| 2018-19 | 2019-20 | 2020-21 | 2021-22 | 2022-23 |
| November | 11 | 51 | 11 | 18 | 59 |
| December | 48 | 97 | 87 | 88 | 133 |
| January | 87 | 145 | 97 | 93 | 146 |
| February | 90 | 114 | 48 | 82 | 150 |
| March | 11 | 74 | 34 | 30 | 95 |
| Table 2. 2023 Season. |
|---|
| Date | ET0 (mm) | Max Temperature | Average Max Temperature | Hours with temperature >30°C |
| 21-22 | 22-23 | 21-22 | 22-23 | 21-22 | 22-23 | 21-22 | 22-23 |
| January 1 | 42.5 | 43.1 | 34.6 | 35.4 | 31.2 | 31.6 | 21 | 20 |
| January 8 | 37.9 | 41.3 | 32.3 | 34 | 30.5 | 30.9 | 18 | 16 |
| January 15 | 36.8 | 41.5 | 33.8 | 35.6 | 31.8 | 32.2 | 19 | 21 |
| January 22 | 38.7 | 43.7 | 35 | 36.8 | 33.1 | 33.4 | 22 | 25 |
| January 29 | 42.3 | 46.8 | 36.6 | 38.1 | 33.9 | 34.1 | 23 | 24 |
| February 5 | 39.9 | 43.9 | 35.5 | 36.5 | 32.8 | 33.3 | 24 | 26 |
| February 12 | 41.6 | 44.5 | 36.4 | 36.9 | 33.2 | 33.5 | 22 | 23 |
| February 19 | 42.1 | 44.3 | 36.9 | 37.5 | 34 | 34.3 | 20 | 22 |
| February 26 | 43.5 | 46.5 | 37.5 | 38.3 | 34.5 | 34.7 | 23 | 25 |
| March 4 | 44.2 | 45.8 | 38.5 | 39.2 | 35 | 35.2 | 24 | 26 |
| March 11 | 44.8 | 47.2 | 39.2 | 39.9 | 35.3 | 35.5 | 26 | 27 |
| March 18 | 43.9 | 46.5 | 38.4 | 38.9 | 34.8 | 35 | 24 | 25 |
| March 25 | 43.6 | 45.2 | 38.1 | 38.5 | 34.9 | 35.1 | 25 | 24 |
| April 1 | 43.8 | 46.3 | 39.3 | 39.8 | 36.3 | 36.5 | 26 | 26 |
| April 8 | 44.5 | 46.7 | 39.8 | 40.5 | 36.5 | 36.7 | 27 | 29 |
| April 15 | 45.1 | 48.5 | 39.4 | 39.9 | 36.1 | 36.3 | 25 | 28 |
At the same time, plants accumulate carbohydrates in their tissues, increasing the sugars in the cell vacuoles and raising the osmotic pressure. This helps them better withstand sub-zero temperatures (e.g., frost) by lowering the freezing point of water within the plant. Combined with the protection from bracts and cottony tissues, this helps protect the buds from low temperatures.
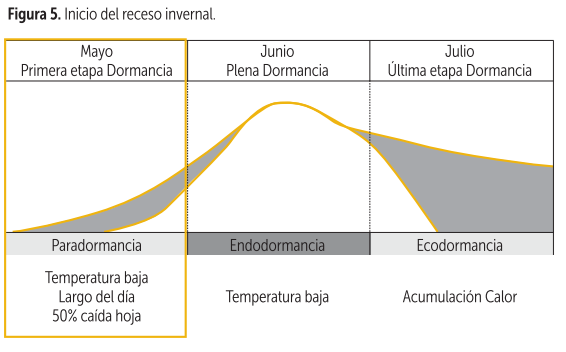 Image 5: Beginning of winter recession.
“It is even possible that the recession may begin in April. This is important because, many times, unlike this year, even without high temperatures, we continue to irrigate and fertilize, maintaining conditions that keep the plant active and prevent it from entering early dormancy,” he states.
The 2022/23 season recorded only 145 hours below 10°C, very similar to the 2019-20 season. However, in the 2021/22 season, we reached 237 hours below 10°C in April. “That was a season with significant winter chill accumulation, which already hinted at a possible recession.”
Dormancy and Cold Accumulation
When entering endodormancy, the phase most associated with cold accumulation, the bud must already be prepared to withstand sub-zero winter temperatures. If, after a warm fall, the bud hasn't closed properly, we might face problems in winter.
We have defined that dormancy begins when 50% of the leaves have fallen. However, “there are years when, by mid-May, a significant percentage of leaves still remain on the tree, and only then do the plants manage to shed their leaves. In my opinion, this is already too late. Based on the April temperatures, we need to consider management practices that promote leaf drop for more normal dormancy,” recommends the specialist.
| Table 3. Hours with Temperature <10°C |
|---|
| 2018-19 | 2019-20 | 2020-21 | 2021-22 | 2022-23 |
| January | 9 | 5 | 6 | 25 | 4 |
| February | 7 | 3 | 11 | 16 | 5 |
| March | 75 | 45 | 53 | 99 | 45 |
| April | 185 | 140 | 194 | 237 | 145 |
| May | 309 | 306 | 321 | 452 | 357 |
During dormancy, starch concentration increases until it reaches its maximum level in the middle of the dormancy period. Then, towards the end of the period, it decreases again because it is converted into other carbohydrates.
Cold Accumulation Models and Their Application
There are different cold accumulation models. The most widely used in Chile is the chill hours model, also known as the Weiberger model. The term “chill hours” (CH) is defined as the hours when temperatures are below 7.2°C, with each hour below this threshold counting as one chill unit.
“This model has the disadvantage of not considering temperatures very close to the upper limit of the range. For example, a record of 7.5°C is not counted as a chill unit, even though it is so close to 7.2. However, from a biological perspective, there is an effect at 7.5°C.”
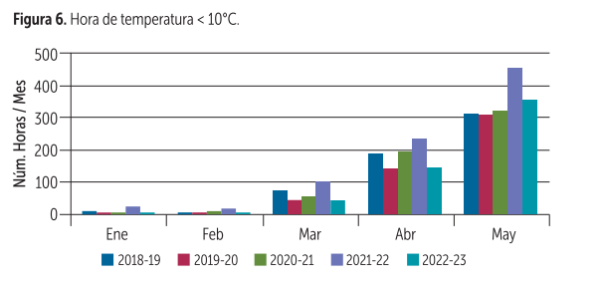 Image 6: Hours with Temperature <10°C.
Table 4 was created using temperature series recorded in an area near Curicó. “It can be noted that by July 15, 2017, 635 chill hours had already been accumulated, but in 2023, only 436 were reached by the same date. In other words, that was a rather poor year in terms of chill, compared to 2022, when 598 chill hours were accumulated. A year with conditions very similar to 2023.”
| Table 4. Chill Hours (<7.2°C). |
|---|
| 2017
| 2018
| 2019
| 2020
| 2021
| 2022
| 2023
|
| May 1 | 0 | 0 | 0 | 0 | 0 | 0 | 0 |
| May 7 | 15 | 29 | 10 | 28 | 17 | 43 | 65 |
| May 14 | 17 | 38 | 56 | 69 | 71 | 50 | 112 |
| May 25 | 132 | 104 | 143 | 134 | 133 | 102 | 127 |
| June 5 | 289 | 215 | 162 | 205 | 147 | 216 | 195 |
| June 15 | 419 | 334 | 236 | 315 | 168 | 322 | 277 |
| June 25 | 482 | 474 | 358 | 337 | 236 | 412 | 304 |
| July 5 | 540 | 504 | 492 | 346 | 391 | 490 | 361 |
| July 15 | 635 | 549 | 575 | 419 | 548 | 598 | 436 |
| July 25 | 749 | 683 | 695 | 471 | 654 | 701 | 501 |
“In 2017, there was excellent chill accumulation (Figure 7), without significant interruptions and at relatively consistent rates. Meanwhile, 2020 started with a good chill accumulation rate, then moderated. For cherries, chill hours are counted up until July 25.”
“The total chill hours in 2020 are quite similar to those in 2017, but the dynamic was very different: the chill accumulation was poor until June, a very important month for cherries, then increased after July 15. In this latter case, although late temperatures below 7.2°C have some effect on breaking dormancy, their impact is less than it would have been if they had been added in June,” explains Espíndola.
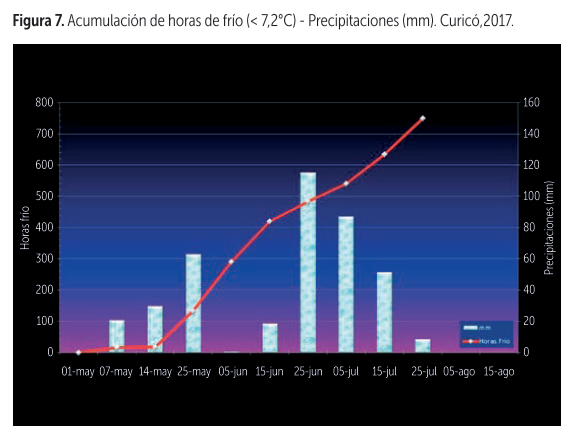 Image 7: Chill Hour Accumulation (<7.2°C) - Precipitation (mm). Curicó, 2017.
In summary, the year 2022 was very similar to 2017, with high chill accumulation, at a steady and consistent pace. “By July 25, we had over 600 chill hours. The year 2023 was different, which like 2020, accumulated only about 400 chill hours by July 25. So, 2020 and 2023 are similar years both in terms of autumn and chill hours.”
Chill Unit Model
Luis Espíndola explains that the chill hour model does not fit well in agroclimatic zones with mild winters, so an alternative model, more effective in low winter chill conditions, was developed. This is the dynamic model.
“In Chile, this model was originally used for northern regions or coastal areas with low winter chill. However, its use has now been extended to other areas, not only to determine if the plant is coming out of dormancy but also to schedule dormancy-breaking applications.”
In a two-phase process, the exposure of the bud to cold is considered or not, taking into account the subsequent temperatures.
Two-phase scheme:
- Intermediate: Formation at temperatures between 0 and 12°C, nullification at temperatures above 16°C.
- Daily cycle: Fixation at cold temperatures 13 - 15ºC
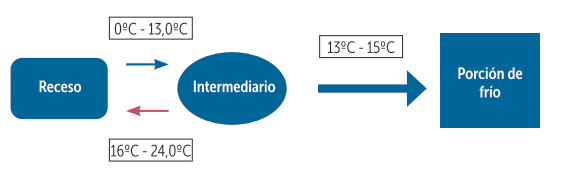
"In simple terms, the dynamic model considers an intermediate or a product that is generated during the day based on temperatures. If a certain threshold is not reached during the day, the intermediate returns to zero. If temperatures are adequate, the intermediate exceeds the threshold and becomes a portion of cold."
"This portion accumulates and is not lost, even if the temperature rises. It differs from models like Richardson's, which subtracts cold when temperatures exceed a certain range."
The intermediate is stimulated at temperatures between 0°C and 13°C. If by the end of the day a sufficient amount of intermediate has accumulated and temperatures are between 13°C and 15°C, it transforms into a cold portion and is no longer lost. Conversely, if the temperature exceeds a threshold, the intermediate returns to zero (it does not accumulate).
< td style="width: 16.6303%;">37
| Table 5. Cold units at Sagrada Familia, Maule Region |
|---|
| 2017
| 2020
| 2021
| 2022
| 2023
|
| May 1 | 0 | 0 | 0 | 0 | 0 |
| May 5 | 2 | 1 | 2 | 3 | 4 |
| May 10 | 4 | 3 | 5 | 5 | 7 |
| May 15 | 5 | 5 | 7 | 8 | 7 |
| May 20 | 9 | 7 | 11 | 12 | 9 |
| May 25 | 12 | 9 | 14 | 16 | 12 |
| May 30 | 16 | 12 | 17 | 19 | 15 |
| June 5 | 20 | 16 | 20 | 22 | 18 |
June 10
| 24 | 19 | 22 | 26 | 21 |
| June 15 | 28 | 23 | 26 | 29 | 24 |
| June 20 | 31 | 26 | 29 | 34 | 28 |
| June 25 | 33 | 30 | 33 | 37 | 28 |
| June 30 | 36 | 34 | 37 | 41 | 31 |
| July 5 | 38 | 41 | 44 | 34 |
| July 10 | 42 | 41 | 45 | 48 | 38 |
| July 15 | 46 | 44 | 49 | 52 | 43 |
| July 20 | 49 | 46 | 52 | 55 | 45 |
| July 25 | 52 | 49 | 56 | 59 | 48 |
Table 5 shows the accumulation of cold portions for five seasons at Sagrada Familia, near the coast of Curicó with a relatively warm climate. “It can be observed that the totals for different years are quite similar, unlike when accounting based on HF, where there can be years with significant differences. In general, we reach about 35 cold portions between June 25 and 30. In 2023, we reached this level a bit later, while in 2022, we reached it around June 20.”
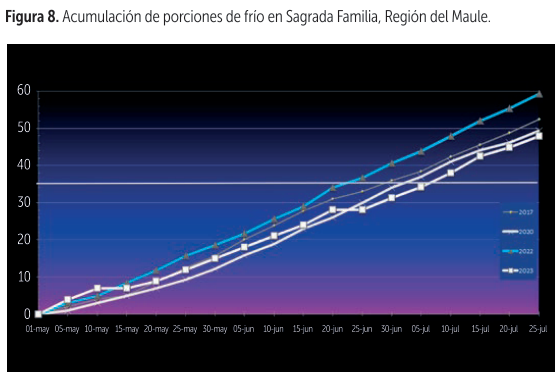 Image 8: Accumulation of cold units at Sagrada Familia, Maule region.
“In the cold portion accumulation chart, we see that in 2023 the accumulation stopped twice, first in May and then in June, during periods of heavy precipitation and rising temperatures. During these periods, this model, designed for low-chill areas, did not record any cold portion accumulation. In contrast, in 2022 we had a rather high accumulation. From this perspective, the best years were 2017 and 2022.
“Today, with changing climatic conditions and rising temperatures, we will increasingly face seasons of low chill accumulation and likely also years of delayed accumulation.”
| Table 6. Cold Units and Cold Portions by Variety |
|---|
| Variety | Cold Portions | Cold Hours (<7°C) |
| Brooks | 36 | 411 |
| Lapins | 35-37 | 500-550 |
| Santina | 42 | 643 |
| Rainier | 42-45 | 643 |
| Skeena | 47 | 674 |
| Sweetheart | 47 | 674 |
| Regina | 47 | 674 |
| Bing | 52 | 700 |
| Kordia/Maxma 14 | 57 | 787 |
| Kordia/Colt | 63 | 887 |
Spring and the End of Dormancy
With the arrival of spring, factors such as frost, bloom temperatures, pollinator activity, flower vitality, fruit setting conditions, growth, and fruit maturation begin to become significant.
"It has been established that dormancy ends when 50% of the buds are capable of budding (eco-dormancy). From that point on, they are sensitive to external conditions, such as temperature, and with adequate thermal accumulation, they can begin to bud. From spring onwards, the plant’s physiology is driven by warmth and the risk of negative events such as frost.
"If a dormant bud can withstand temperatures down to -8°C, a swollen bud can be damaged at -4°C and, in the balloon stage, at -2°C. "But if we have flower buds with poor reserve accumulation, they can be affected even by temperatures above -1°C, as they will be much more susceptible compared to when the bud has accumulated good reserves. This is why post-harvest is so important, the period during which fruit forms and reserves are generated."
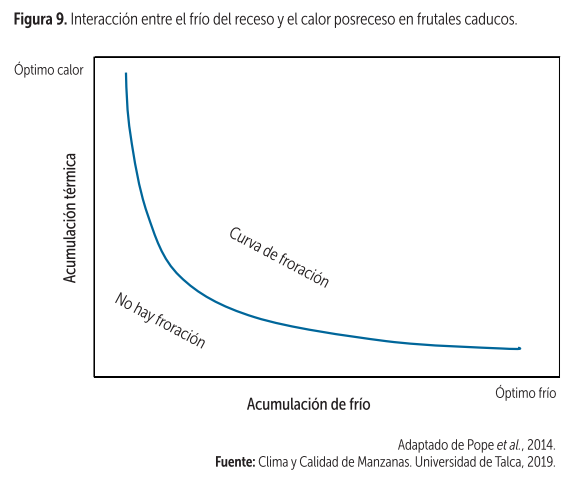 Image 9: Interaction between dormancy cold and post-dormancy heat in deciduous fruit trees.
In simple terms, “if we have flower buds with poor reserve accumulation, they can be affected, as shown in Figure 9, that when there is optimal cold accumulation during winter dormancy, only a small amount of heat is needed in spring to advance to the phenological stage. Therefore, a small accumulation of growing degree days is enough to trigger the processes of budding and flowering,” Espindola emphasizes.
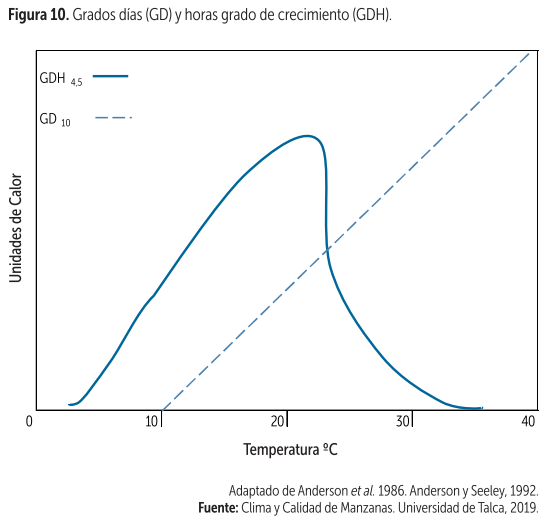 Image 10: Degree-days (GD) and growing degree hours (GDH).
On the other hand, if there is low cold accumulation in winter, the plant will not have a clear signal that winter is over, so it will need to accumulate more heat. “For example, in 2022 we had a good cold accumulation and the plant reacted quite well, even though the beginning of spring was cold. If it had been a year with low winter cold, a very cold spring start would have delayed germination, flowering, harvest, etc.
Growing Degree Day Model
The most commonly used method for measuring thermal accumulation by Chilean producers is the degree-day (GD) model. “A system based on a linear function where daily average temperatures are subtracted from a base or threshold temperature, which in this case is 10°C. This system does not distinguish between temperature ranges, unless temperatures fall below 10°C, below which no GD accumulation occurs.”
Degree Day = [(max + min)/2] - Base Tº.
Espindola presents a “relatively new but long-developed” system for measuring thermal accumulation, the growing degree hours model, which has a base temperature of 4.5°C.
| Table 7. Thermal Requirements: Growing Degree Hours from End of Dormancy to Bud Break. |
|---|
| Lapins | 6,000 |
| Rainier | 6,007 |
| Santina | 6,723 |
| Skeena | 6,258 |
| Sweetheart | 6,723 |
| Regina | 6,294 |
| Bing | 6,147 |
| Kordia/Maxma | 6,643 |
| Kordia/Colt | 7,031 |
However, “this model has the paradox that, once the cold requirement is met, for example, on July 10, even temperatures of 7°C can be considered as heat accumulation. It does not correspond to a linear function and has an optimal range between 20 and 25°C, then decreases rapidly to 35°C, a threshold above which it is no longer considered heat accumulation.
Whereas in the DG system, it would be counted. Once winter cold has already been fulfilled for the variety/rootstock in the growing area, this model - additionally - allows estimating the time of bud break,” the consultant emphasizes.
"Accumulation rates in Curicó from the end of dormancy to bud break are about 6,000 growing degree hours. This is an average, as there are differences between varieties, but it allows predicting that flowering will occur within a certain date range.
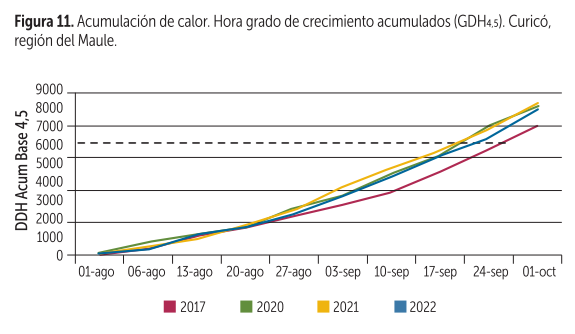 Image 11: Heat accumulation. Cumulative Growing Degree Hours (GDH), Curicó, Maule region.
“Some studies have analyzed heat requirements, after meeting cold requirements, to reach 50% bud break in different varieties." According to Table 7, Lapins requires 6,000 and Santina 6,723, while at the opposite extreme Kordia on Maxma requires 6,643, but on Colt 7,031. This, on the other hand, reinforces the hypothesis that rootstock influences heat accumulation requirements.
Climatic variability and the general trend of increasing temperatures require a better understanding of the consequences of climate change on physiology and, ultimately, on crop productivity. Choosing models that best represent the effect of winter cold or spring warmth will allow for anticipating important phenological events and managing the crop to produce the highest quality fruit.
Source: Redagrícola
Images: Redagrícola
Cherry Times - All rights reserved