Cherries are non-climacteric fruits, with a moderate respiration rate of 6-10 mg CO2 kg-1 h-1 at 0°C and very low ethylene production. It is recommended to cool them to less than 5°C within 4 hours of harvest. Methods such as room cooling, forced air cooling, and hydro-cooling are used for this purpose.
The optimal storage conditions are from -1 to 0°C with a relative humidity (RH) above 95%, maintaining good quality for up to 4 weeks under these conditions (Gross et al., 2016).
Sea transit to distant markets such as China and India can take 30-40 days. Additionally, it is necessary to consider the processing of the fruit on the line and their subsequent commercialization in the destination country's domestic market.
Therefore, for these distant markets, long post-harvest periods may lead to quality issues such as softening, dehydration, and browning of the pedicels and fruit, as well as rots. Thus, it is crucial to implement continuous improvements in post-harvest handling to preserve the organoleptic qualities of cherries and minimize deterioration in these markets.
The use of controlled atmospheres with moderate concentrations of oxygen and carbon dioxide is an effective technique to reduce metabolic activity and maintain fruit quality. Regulating O2 and CO2 concentrations helps to reduce dehydration and the incidence of rots, while maintaining optimal temperature conditions is essential.
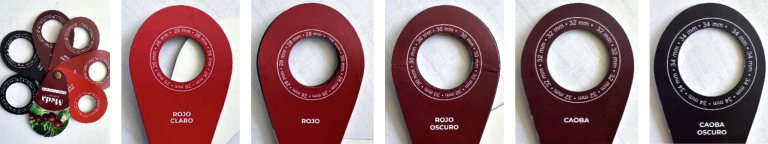 Figure 1: Maturity scale based on the external color of cherries (A. full scale; B. light red; C. red; D. dark red; E. mahogany; F. dark mahogany).
According to Mattheis et al. (1997), the recommended conditions range from 1 to 5% O2 and 5 to 20% CO2. Based on these premises, it is essential to study the effect of controlled atmospheres with low to moderate concentrations of oxygen and carbon dioxide on the post-harvest quality of Regina cherries, harvested at three maturity stages, during simulated storage for up to 42 days.
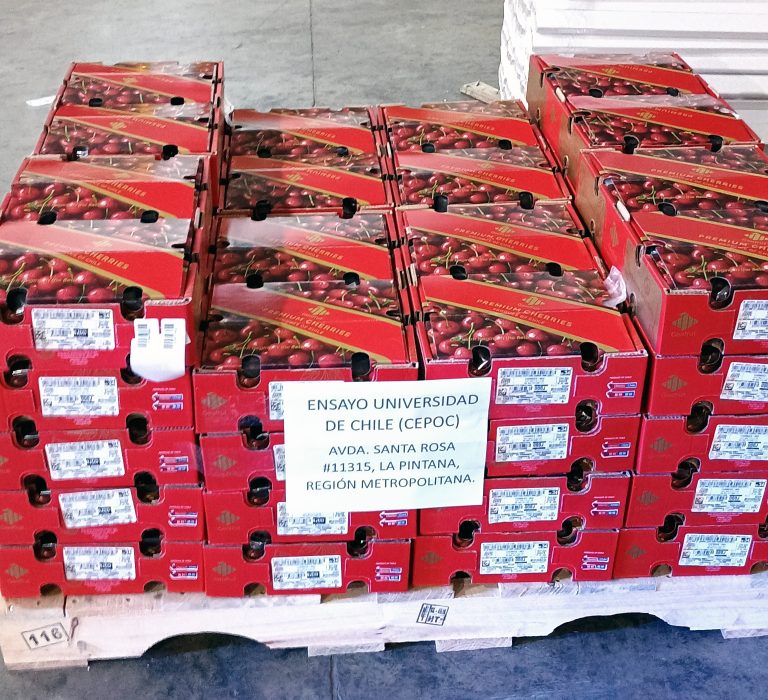
The study used 57 boxes of 2.5 kg Regina cherries harvested at three maturity stages: C1 (light red), C2 (dark red - red mahogany), and C3 (dark mahogany). Of these boxes, 38 were packed in perforated bags (0.05% ventilated area) and the others in modified atmosphere bags. The boxes were cooled with forced air and then transferred to the CEPOC (Photo 1). All boxes were stored in a refrigerated room at 0°C.
The fruits in perforated bags were placed in sealed cabinets with gas injection at concentrations of 5% O2 + 12% CO2 (5+12) and 7% O2 + 15% CO2 (7+15) (Photo 2). Nine treatments were established, with three replicates where one replicate was a box (Table 1).
| Table 1. Post-harvest treatments applied to Regina cherry variety |
|---|
| Treatment | Maturity Stage (color)* | Bag |
| Control | C1 | MA |
| Control | C2 | MA |
| Control | C3 | MA |
| CA1 (5% O2 + 12% CO2) | C1 | Perforated |
| CA1 (5% O2 + 12% CO2) | C2 | Perforated |
| CA1 (5% O2 + 12% CO2) | C3 | Perforated |
| CA2 (7% O2 + 15% CO2) | C1 | Perforated |
| CA2 (7% O2 + 15% CO2) | C2 | Perforated |
| CA2 (7% O2 + 15% CO2) | C3 | Perforated |
| *Maturity Stage: Light Red (C1), Red-Red Mahogany (C2), and Dark Mahogany (C3). |
Additionally, 10 boxes of 500 g with fruit were placed in the three maturity stages under the same conditions to monitor weight losses. One box for each maturity stage was evaluated at the start of storage. Subsequently, evaluations were made after 35 and 42 days, plus a 3-day commercialization period at 10°C.
Fruit Evaluation
To monitor gas conditions during storage, sensors were used inside the cabinets and a portable gas analyzer for the bags (PBI Dansensor). Temperature and relative humidity were also recorded in the chamber (Thermo-Hygrometer). The following parameters were assessed in the fruit:
- External color using a Minolta CR 300 chromameter. The color scale was determined in the fruit pedicel.
- Firmness with a Texture Analyzer (TA.XT2i, Stable Micro Systems) and a 4.0 mm probe. Firmness was measured on two opposite sides of each fruit.
- Pedicel browning was assessed visually.
- Weight loss of cherries was calculated from the difference between the initial and final weights.
- Decay incidence was evaluated by visual inspection.
For all evaluations, at least 30 fruits per replicate were used. Additionally, 10 boxes of 500 g with fruit were placed at the three maturity stages under the same conditions to monitor weight losses. One box per maturity stage was evaluated at the beginning of storage. Subsequent evaluations were made after 35 and 42 days, plus a 3-day commercialization period at 10°C.
To monitor gas conditions during storage, sensors were used inside the cabinets and a portable gas analyzer for the bags (PBI Dansensor). Temperature and relative humidity (RH) were monitored with datalogger sensors (RC51H, Elitech) and analog instruments.
Physical parameters: Weight loss was measured as the difference in weight. The fruit condition was assessed for the presence of bruising and rots. The incidence of russeting and pedicel dehydration was quantified as acceptable or unacceptable. Firmness was measured using compression with the FirmPro equipment (gf/mm). Internal browning was characterized based on the percentage of surface area affected.
Chemical parameters: In a juice sample, the concentration of total soluble solids (TSS) was measured with a temperature-compensated refractometer (DR - A1, ATAGO). Additionally, a titration was performed to obtain the acidity (TA) values expressed as a percentage of malic acid, and the TSS/TA ratio was calculated.
Statistical analysis: A completely randomized design with a 3×3 factorial structure was used. The factors were: type of atmosphere (3 levels) and maturity stage (3 levels). Data were analyzed using mixed linear models, and if significant differences were found in the interaction of the factors or independently, Fisher’s multiple comparison test (PCM) was performed (α=0.05).
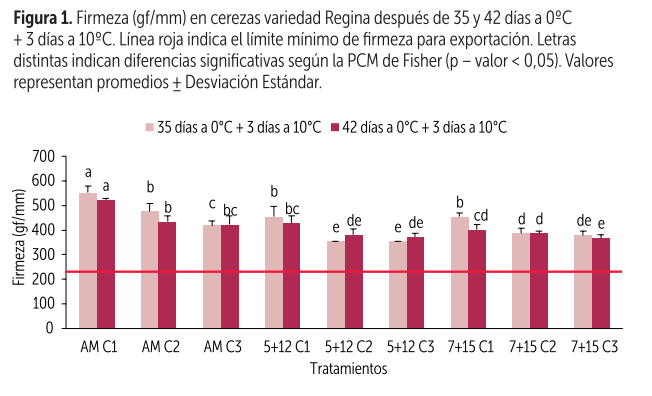 Figure 1: Firmness (gf/mm) of Regina cherries after 35 and 42 days at 0°C + 3 days at 10°C. The red line indicates the minimum firmness limit for export. Different letters indicate significant differences according to Fisher’s PCM (p-value < 0.05). Values represent means ± standard deviation.
Results
Initial Evaluation: In general, the fruit showed good quality initially. The presence of bruising was higher in the C3 maturity stage at 32.7%, compared to C1 and C2 at 30% and 27.3%, respectively.
Firmness was highest in C3 with 396 gf/mm, followed by C2 (347 gf/mm) and C1 (324 gf/mm), all above the minimum export limit of 225 gf/mm. The concentration of soluble solids ranged from 19.2% to 21.3%, and acidity was between 0.6% and 0.7%, with a TSS/TA ratio ranging from 30.6 to 31.1.
Gas Concentration: During storage, the average values of O2 and CO2 in the MA bags were 16% and 5%, respectively. Inside the CA cabinets, O2 concentrations were maintained at 4.5-5.5% + CO2 at 11.4-12.3% and 6.9-7.8% O2 + 14.7-15.2% CO2. After 35+3 and 42+3 days, the O2 concentrations inside the MA bags were 8.6% and 9.2%, respectively.
In these same treatments, the CO2 concentrations were 12.6% and 11.1%, respectively, for both periods. For perforated bags, at the end of the commercialization period, the levels were close to 20% O2 and 1% CO2.
Physical Parameters: After 35+3 days, the greatest weight loss was recorded in the C3 treatment with 10.5%, and the least in MA C1 with 5.8%. After 42+3 days, the incidence of bruising was highest in 5+12 C2 and C3 with 43.6% and 45.8%, respectively, compared to MA C1 with 29.6%. Firmness was highest in the MA C1 treatment with 552 gf/mm, while the lowest was in 5+12 for C2 and C3 with 354 gf/mm.
After 42+3 days, the highest firmness was recorded in MA C1, with 521 gf/mm, and the lowest in C3 at 7+15, with 367 gf/mm. Firmness values after storage were higher compared to the start and above the minimum limit for export (Figure 1).
The fruit maintained a good overall condition after the storage and commercialization periods. After 35+3 days, the incidence of bruising was higher in MA C3 and C2, with 64.3% and 60%, respectively, and lower in MA C1, with 29.3%. Decay occurred in less than 0.7% of the fruit, with no significant differences between treatments. After 42+3 days, the incidence of decay was higher in 5+12 C3 with 86.3% and lower in MA C1 with 56.3%. The incidence of decay was higher in MA C2 with 6%, while in the rest of the treatments it was below 0.7%.
After 35+3 days, the incidence of russeting in the unacceptable range was highest in MA C3 (31.1%) and 5+12 C2 (24.4%), while 7+15 C1 had no affected fruit. After 42+3 days, this disorder was highest in MA C3 and 7+15 C3, with 58.9% and 57.5%, respectively, and lowest in 7+15 C1 (21.1%).
After 35+3 days, pedicel dehydration in the unacceptable range was highest in 7+15 C2 (47.6%) and lowest in 5+12 C1 (7.8%). At 42+3 days, the incidence was highest in MA C3 with 62.2% and lowest in 5+12 C3 with 27.8%. After 35+3 days, most fruit showed browning between 0 and 25% of the pulp, with MA C3 having the highest value at 99.3%. The MA C2 treatment had the highest percentage of fruit with browning (over 25%).
The MA C2 treatment recorded the highest percentage of fruit with browning (over 50% of the pulp), with one box reaching 59% (Figure 2). After 42+3 days, the highest percentage of fruit with 0-25% browned pulp was recorded in MA with 93.5%. In the 25-50% range, the highest percentage was recorded in 5+12 (10.4%) (Figure 3). However, as with 35+3, MA C2 showed high variability in browning values.
Chemical Parameters: The percentage of total soluble solids decreased after storage. After 35+3 days, the highest value was recorded for C2 at 19.1%, followed by C3 (18.7%) and C1 (17.4%). After 42+3 days, 5+12 C3 had the highest value at 19.4%, followed by MA C2 (18.2%) and 7+15 C1 (17.6%).
Acidity showed a decrease after storage, with the highest values at 35+3 days recorded for MA and C1 at 0.63% and 0.59%, respectively, while the lowest values were recorded for 5+12, 7+15, and C3 at 0.5%. After 42+3 days, MA maintained the highest values at 0.51%, followed by 5+12 (0.43%) and 7+15 (0.39%). Regarding the TSS/TA ratio, an increase was observed compared to the beginning of storage.
After 35+3 days, the highest values were for 5+12, 7+15, and C3 with 38.3-38.7, while the lowest were for MA (28) and C1 (31.4). After 42+3 days, the highest values were recorded for 7+15 (46) and C3 (46.2), and the lowest for MA (36.2) and C1 (38.5).
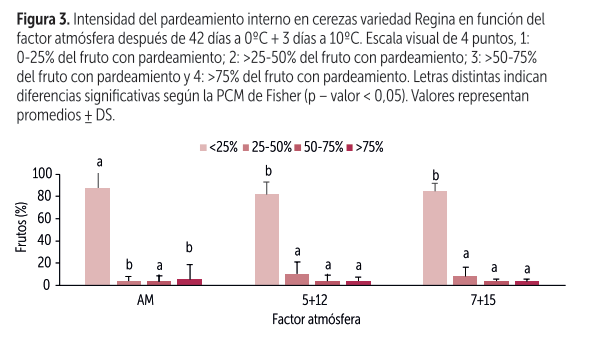 Figure 3: Internal browning intensity in Regina cherries as a function of the atmosphere factor after 42 days at 0°C + 3 days at 10°C. Visual scale of 4 points: 1: 0-25% of fruit with browning; 2: >25-50% of fruit with browning; 3: >50-75% of fruit with browning; 4: >75% of fruit with browning. Different letters indicate significant differences according to Fisher’s PCM (p-value < 0.05). Values represent means ± standard deviation.
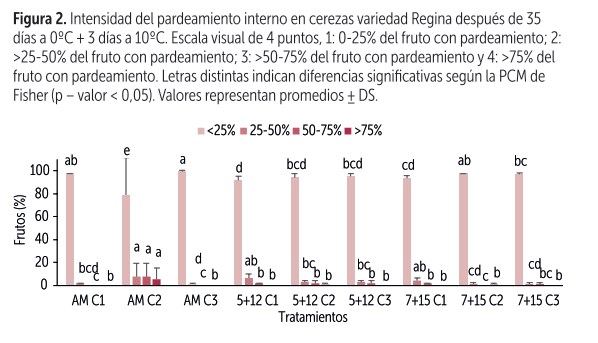 Figure 2: Internal browning intensity of Regina cherries after 35 days at 0°C + 3 days at 10°C. Visual scale of 4 points: 1: 0-25% of fruit with browning; 2: >25-50% of fruit with browning; 3: >50-75% of fruit with browning; 4: >75% of fruit with browning. Different letters indicate significant differences according to Fisher’s PCM (p-value < 0.05). Values represent means ± standard deviation.
Conclusions
The combination of CA and perforated bags ensured the desired gas concentrations and relative humidity for cherries. These CA atmospheres with moderate O2 and CO2 concentrations better preserved the quality of cherries, reducing decay and internal browning. After the commercialization period, gas concentrations inside perforated bags were similar to those in air, and MA bags showed values close to 15% CO2.
The incidence of russeting tended to decrease with the use of controlled atmosphere. The presence of russeting was higher in fruit harvested at more advanced maturity stages.
Source: Redagrícola
Images: Redagrícola
Cherry Times - All rights reserved