With compressed prices and record volumes, margins are no longer won through volume. They are won through condition on arrival and cost per exported kilogram. This is where phenology makes the difference.
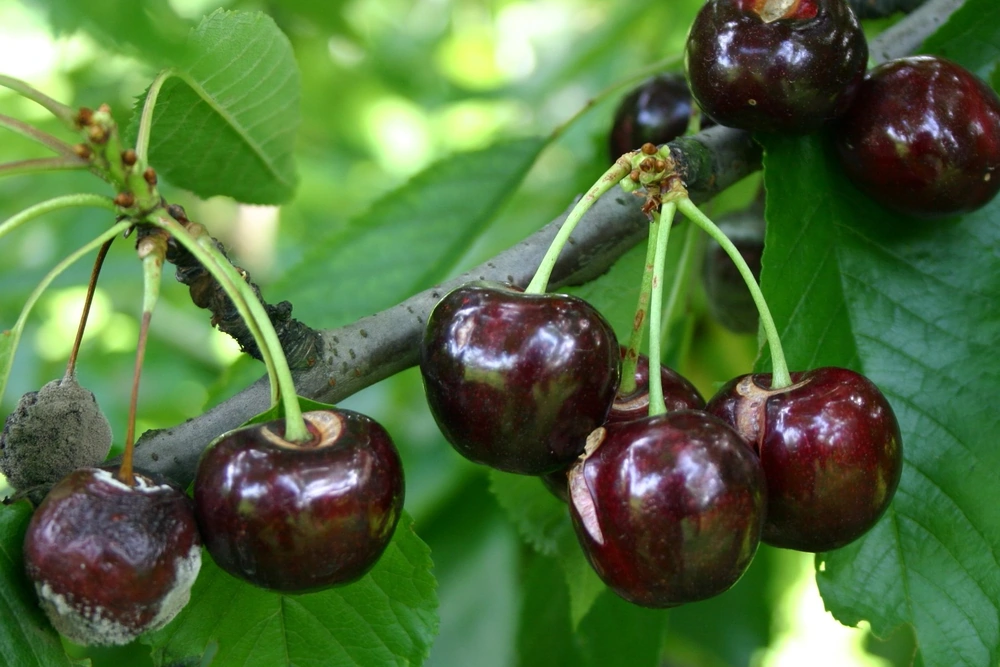
The context has changed, and so has the reasoning
For a decade, the discussion around the Chilean cherry industry has focused on growth. The national planted area has gone from marginal levels to approaching 80,000 hectares, with Maule and O'Higgins accounting for approximately 82% of the cultivated area.
The 2025/26 season reached around 670 thousand tonnes exported and, according to ODEPA, cherries generated a total of US$2.82 billion (approximately 2.43 billion euros) between September 2025 and June 2026.
Yet a significant share of growers ended the season at a loss.
The reason was not volume, but two consecutive seasons characterized by oversupply and low prices. When the selling price is compressed, the orchard's economic equation is turned upside down. Producing more is no longer what generates profit.
Profit comes from producing at a lower cost
Profit comes from producing at a lower cost for every kilogram actually exported and reducing the amount of fruit lost between flowering and arrival at destination.
This is why phenological monitoring has stopped being merely a technical issue and has become an economic issue.
Phenology is a risk calendar, not a botanical curiosity
Each stage of the cherry tree opens and closes a different window of vulnerability. An orchard at the bud stage is not managed in the same way as one in full bloom or pre-harvest. The BBCH scale exists precisely to make this communication accurate among agronomists, growers and exporters.
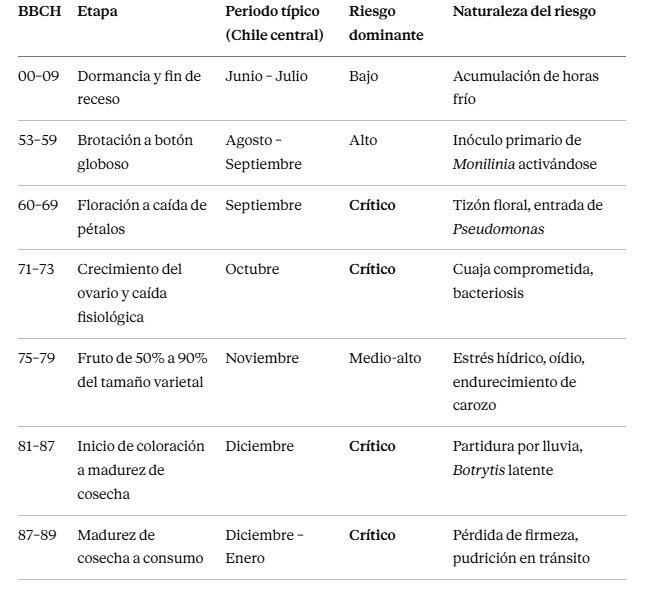
BBCH stages of the cherry tree and their corresponding risk windows - Scale reference: Meier, BBCH monograph on the phenological stages of stone fruit.
Technical note: pit hardening occurs within principal stage 7, which relates to fruit development, and not in stage 8. Stage 8 corresponds to ripening: 81 indicates the beginning of coloring and 87 harvest maturity.This is an important detail, because it determines when a calcium treatment or irrigation management is applied in time and when, instead, it arrives too late.
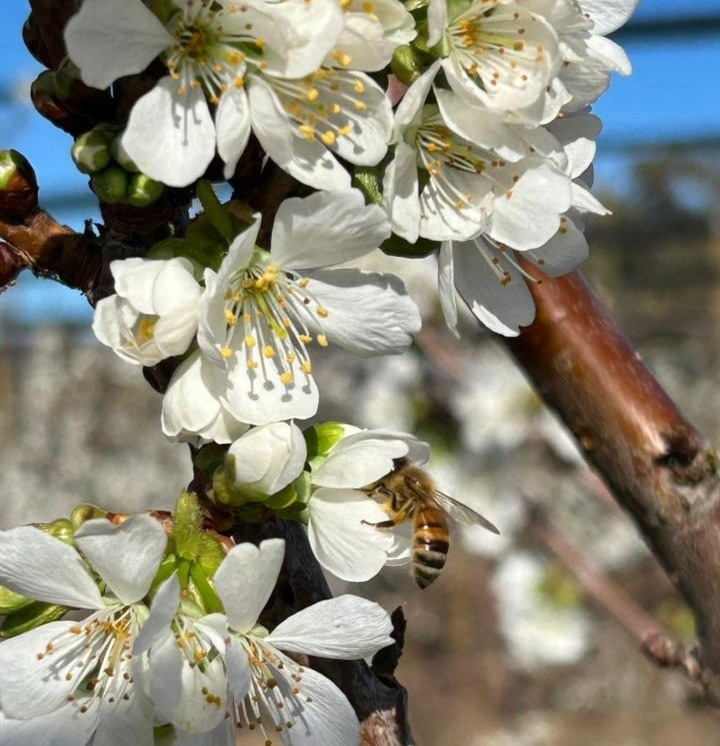
Cherry blossom in Chile: “Ovalle will have the best expression in its history”
The industry's most costly mistake: reading relative humidity instead of wetness hours
This is where most monitoring programs fail, and it is worth saying it without too many roundabout explanations.
Infection by Monilinia laxa is not triggered by a relative humidity threshold. It depends on the combination of leaf wetness duration and temperature. The plant pathology literature is explicit:
- M. laxa requires temperatures above 13 °C, with an optimum close to 24 °C.
- At 10 °C, infection of flowers requires approximately 18 hours of wetness.
- At 24 °C, 5 hours are sufficient.
- UC IPM places favorable conditions during flowering, for cherry trees, within the range of 14 to 25 °C.
The practical consequence is not particularly reassuring
The practical consequence is not particularly reassuring: one orchard can record 90% relative humidity throughout the night without developing an infection, while another can record 78% with persistent dew and still be affected.
A sensor measuring only relative humidity cannot distinguish between the two scenarios. A leaf wetness sensor integrated with temperature data, on the other hand, can.
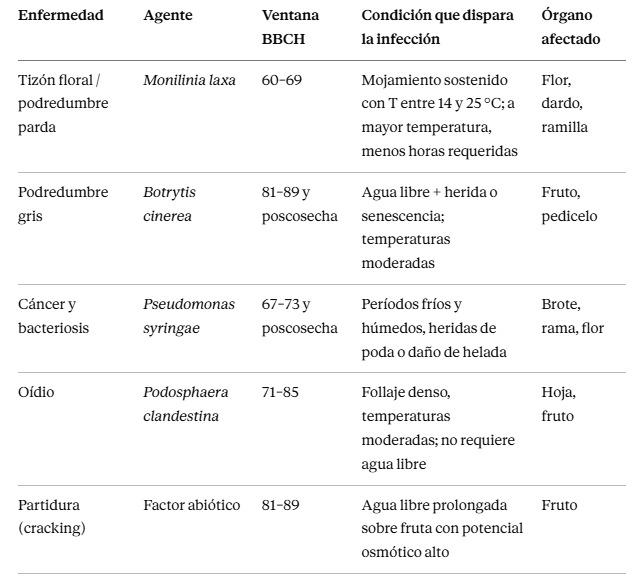
Main pathogens by phenological window
As for cracking: it is not a disease, but a physical phenomenon. It occurs following prolonged contact of the fruit with free water, caused by rainfall or excess water in the soil, close to harvest.For this reason, the response is not a fungicide, but logistical anticipation: bring the harvest forward, activate drying systems, manage irrigation. And anticipation requires a forecast, not an inspection.
What monitoring really changes, and what it does not change
On this point, it is necessary to be transparent, because the sector is already saturated with promises expressed in percentages.
Phenological monitoring does not eliminate climate risk. It cannot stop December rain. However, it does something more specific and more useful: it turns a reactive decision into an anticipatory decision and converts a fixed application calendar into one conditioned by actual risk.
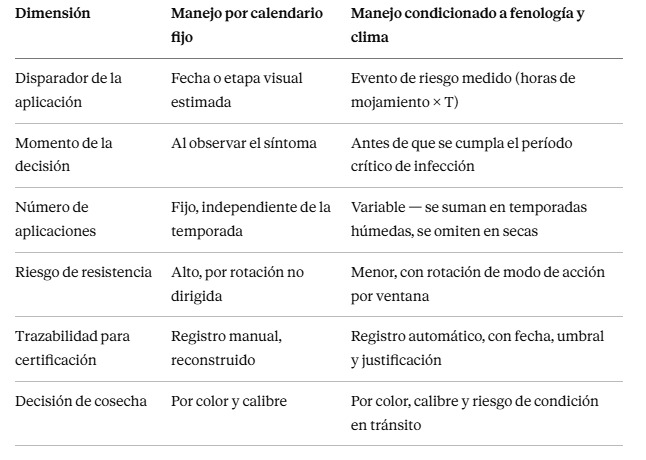
Calendar-based management vs. condition-based management
The main advantage is not a percentage. It is the intervention window: the difference between knowing on Monday that favorable infection conditions will occur on Wednesday and discovering on Friday that the infection has already occurred.How to calculate your own ROI without borrowing someone else's numbers
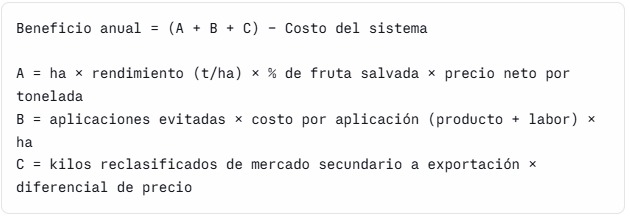
Instead of citing results obtained in other orchards, I propose the model so that each grower can apply it to their own figures. It is more useful and it is verifiable.
Formula:
Illustrative example: stated assumptions, not a measured result
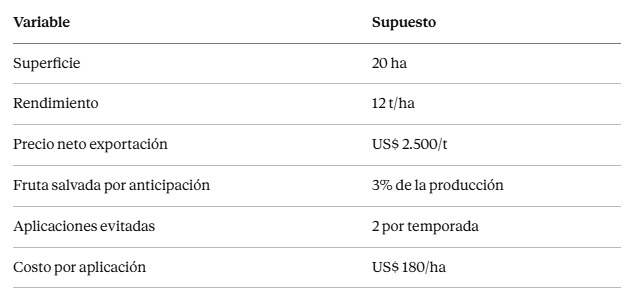
- A = 20 × 12 × 3% × 2,500 = US$18,000 (approximately 15,484 euros)
- B = 2 × 180 × 20 = US$7,200 (approximately 6,193 euros)
- Gross benefit ≈ US$25,200 (approximately 21,677 euros) over 20 ha
Compare this value with the cost of the system in your case. And compare it also with the structural alternative: the industry has invested in rain covers, with an installation cost close to US$22,000 per hectare (approximately 18,924 euros per hectare), and it is estimated that around 15% of orchards are equipped with them.
Monitoring does not replace this investment, but it costs an order of magnitude less and is what determines whether the cover is used correctly.
Transparent rule: if, after applying the model to your figures, the result is not clearly positive, do not buy the system. A supplier who does not provide you with the formula needed to disprove their own claims is simply selling you a story.
What we monitor at AgroPhytus
Our fertilization and precision phenological management system is based on five levels that operate together:
1. Real-time climate. A connected weather station measures temperature, relative humidity, precipitation and, above all, leaf wetness hours, the variable that actually makes it possible to predict infection risk.
2. NDVI and NDWI satellite indices. Periodic updates make it possible to detect differences in vigor and water stress at block level before they become visible in the field.
3. Growing degree-day model. Projection of phenological development to anticipate entry into each BBCH window instead of merely recording it after it has already occurred.
Stage-based alert engine
4. Stage-based alert engine. Notifications associated with the BBCH code, indicating the threshold reached and the available intervention window.
5. Traceable record. Every alert, decision and application is recorded with the date, source data and corresponding rationale, in the format required by certification protocols and buyers in destination markets.
Seven questions to assess your program this season
- Do you measure leaf wetness hours or only relative humidity?
- Do you know which BBCH code each block is at today, or do you simply define it as “flowering” or “fruiting”?
- Are applications during flowering decided according to the date or to actual measured conditions?
- In the event of an audit, can you reconstruct why you carried out a specific treatment on September 14?
- Do you alternate modes of action according to the risk window, or do you repeat the same program every year?
- Does the decision on the harvest date also consider the risk associated with conditions during transport?
- At current prices, do you know your cost per kilogram actually exported, and not simply per kilogram produced?
If three or more answers feel uncomfortable, the problem is not technological. It is an information problem.
Conclusion
In a season characterized by high prices, monitoring represents an improvement. In a season of compressed prices, it can make the difference between a profitable season and one sustained by credit.
The question is no longer whether the technology works. The question is whether a company can continue making critical decisions, from flowering to harvest and through to shipping, without having the data that condition those decisions.
At AgroPhytus, we work precisely at this level: turning agronomic data into a decision with a date, a threshold and a person responsible.
Which of the seven questions made you feel the most uncomfortable? I am interested in reading your answers in the comments.
Source: Agrophytus
Opening image source: Stefano Lugli
Cherry Times - All rights reserved