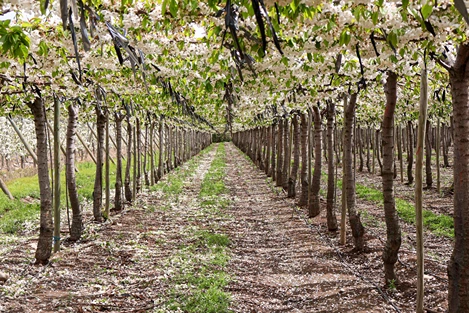
Predicting sweet cherry hardiness is vital for frost management, as their early spring development makes them vulnerable. Current methods using phenology charts are often inaccurate, especially in early bud stages where internal changes occur without visible external signs.
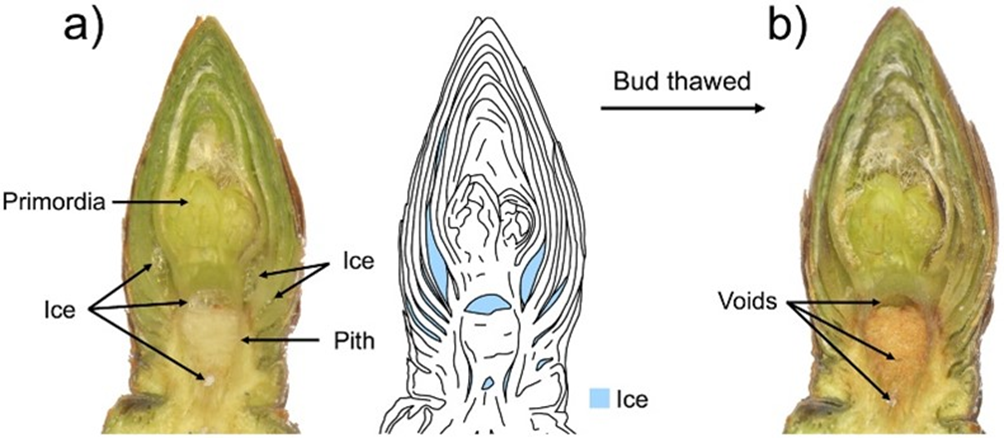 Image 1. Cross-section of a cherry blossom bud
A new cold hardiness model on AgWeatherNet aims to improve accuracy by incorporating local weather and data from multiple cultivars and regions. Sweet cherry floral development is a year-long process, pausing in dormancy and resuming in late winter.
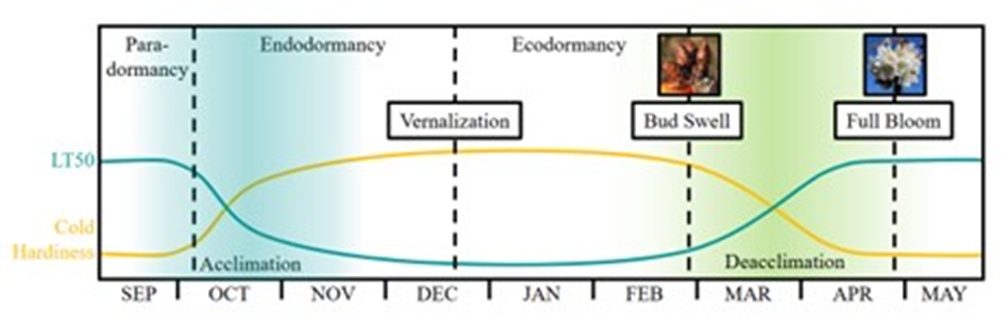 Image 2. Dormant phases with acclimatisation in autumn and de-acclimatisation in spring. The lethal temperature at which 50% of the buds will die (LT50) decreases as the buds become more resistant to cold (yellow). Vernalisation is the point at which all cold units have been accumulated. Graph adapted from Greg Lang, MSU.
Current LT estimations rely on charts that can be unreliable, prompting the development of the new model.
The model provides average lethal temperatures (LT) band damage ranges, but field assessment is crucial to account for orchard variations. Growers are encouraged to provide feedback on the beta model, which will be further validated.
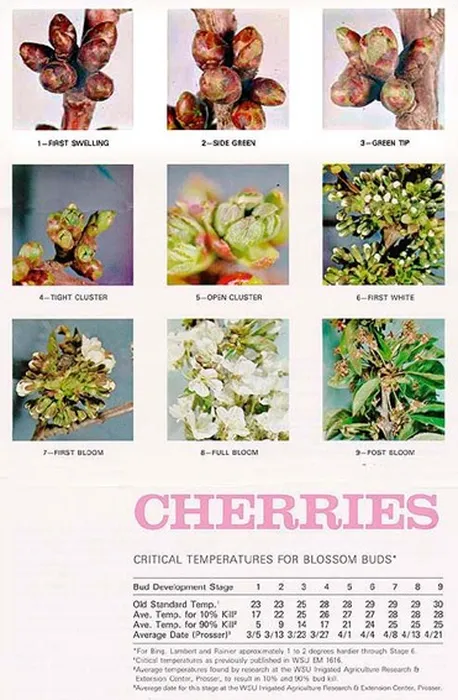 Image 3. The lethal temperatures of cherry buds are currently estimated using graphs predicting LT with bud phenology
Cold acclimation involves supercooling, where ice forms around the floral primordia, protecting the liquid inside. Dormancy phases influence cold hardiness, with deacclimation in spring being critical.
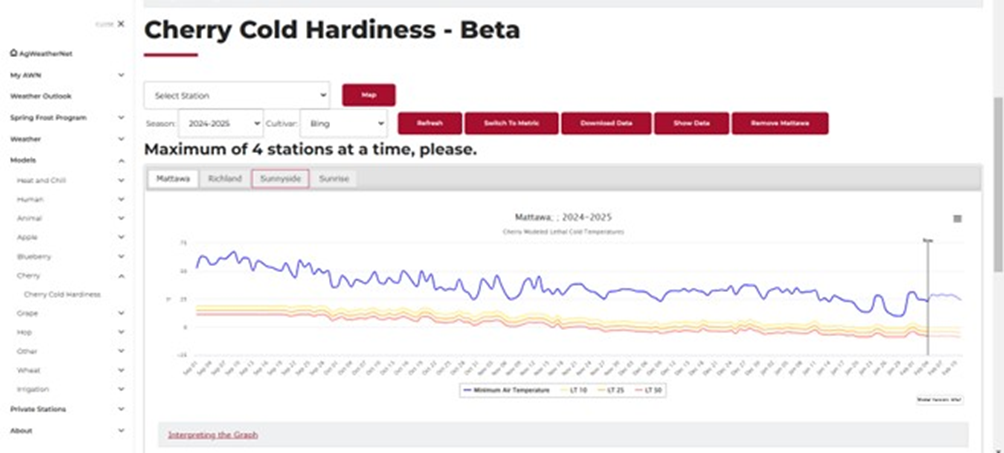 Image 4. Screenshot from the AWN website
Read ful article: WSU Tree Fruit
Cherry Times - All rights reserved