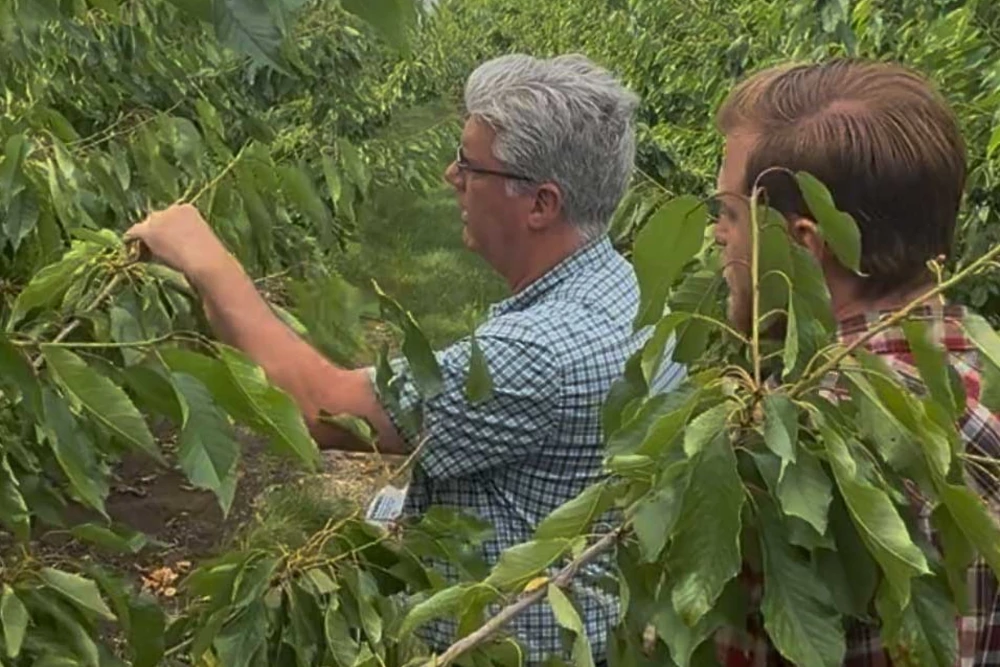
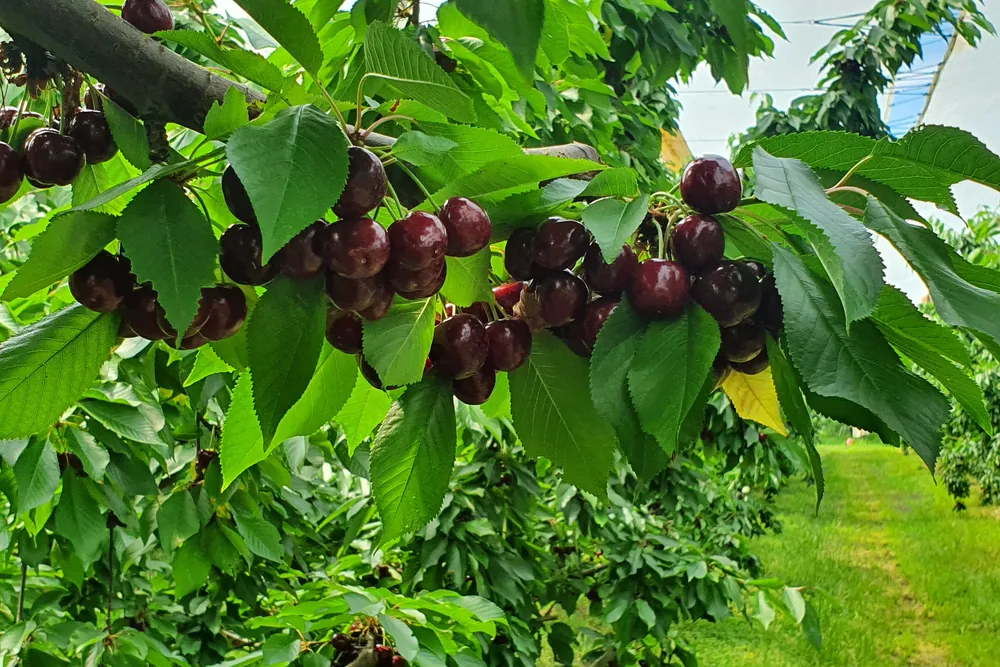
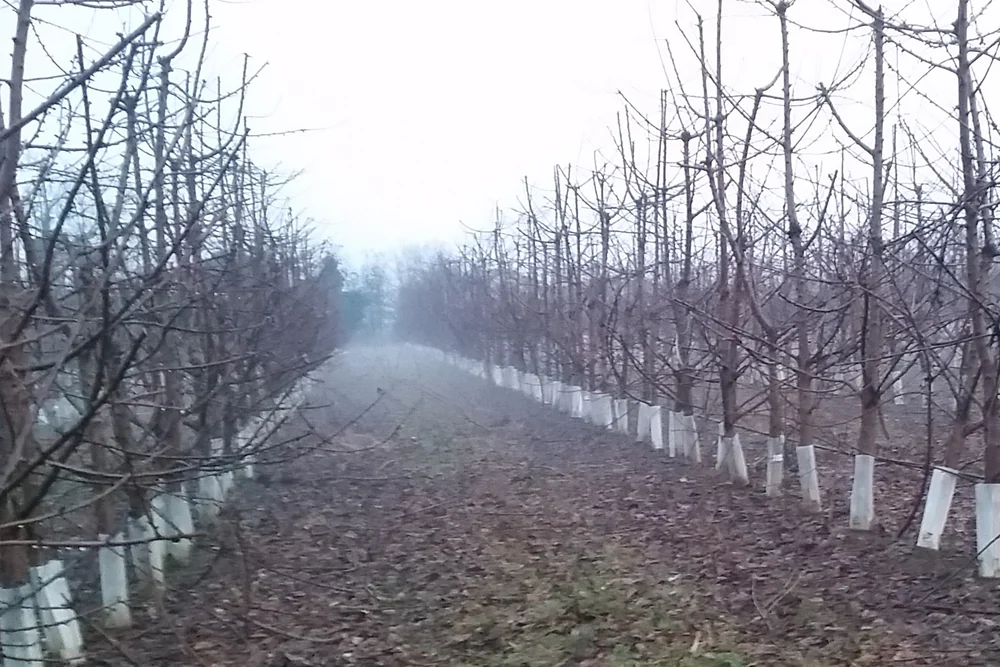
Dormancy is one of the most complex physiological phases in the annual cycle of sweet cherry, during which the plant coordinates profound metabolic and functional changes to prepare for winter conditions.
Traditionally, the transition between the different dormancy phases has been monitored based on chilling accumulation and bud-forcing tests, which are effective but labor-intensive tools. A recent study proposes a new approach integrating physiological measurements, metabolomic analyses, and vegetation indices derived from satellite imagery, demonstrating how this combination can provide a comprehensive and accurate description of dormancy establishment and open new perspectives for phenological monitoring in orchards.
The study compared two sweet cherry genotypes with different chilling requirements, ‘Regina’ and the experimental genotype ‘210’, following their progression from full vegetative activity to dormancy onset.
Physiological activity
Measurements of leaf gas exchange and chlorophyll fluorescence revealed a progressive reduction in CO₂ assimilation, transpiration, photosystem II photochemical efficiency, and electron transport during the transition toward dormancy.
At the same time, intercellular CO₂ concentration and non-regulated energy dissipation increased, indicating a gradual deactivation of the photosynthetic apparatus and a reduction in the plant’s metabolic demand.
These results confirm that dormancy does not simply coincide with the cessation of visible growth, but represents a complex physiological process involving the entire tree.
Metabolic profile
Metabolomic analysis of floral buds showed that the factor accounting for most of the observed differences was not dormancy stage, but genotype. In particular, almost half of the variation in the metabolic profile was attributable to genetic differences, whereas the contribution of phenological stage was much smaller.
Among the metabolites analyzed, fructose emerged as the main discriminating indicator, reaching concentrations approximately 9.5 times higher in ‘Regina’ during paradormancy I than in genotype ‘210’.
Malic acid, myo-inositol, glucose, and sorbitol also contributed to the metabolic characterization, highlighting the central role of carbohydrate metabolism during the early stages of dormancy.
Metabolic pathway analysis identified starch and sucrose metabolism and pyruvate metabolism as the biochemical pathways most strongly involved in the physiological transition.
Vegetation indices
The vegetation indices NDVI and FAPAR, derived from Landsat and Sentinel imagery, accurately tracked the progressive decline in canopy activity during autumn senescence and the subsequent recovery of vegetative activity in spring.
NDVI, in particular, showed a strong ability to describe seasonal canopy dynamics and estimate the timing of leaf senescence, with an average difference of approximately five days compared with field observations.
In addition, both indices showed relationships with several leaf-level physiological parameters, including PSII efficiency, electron transport, transpiration, and intercellular CO₂ concentration, confirming that canopy spectral signals indirectly reflect the physiological status of the plant.
The observed relationships were partly genotype-dependent, suggesting that spectral responses may vary according to the genetic background of cultivars.
Dormancy monitoring
Overall, the study demonstrates that integrating plant physiology, metabolomics, and satellite observations represents a promising approach for monitoring dormancy in sweet cherry orchards.
The continuous and free availability of imagery from the Sentinel and Landsat missions makes it possible to develop scalable monitoring tools that are less dependent on manual field assessments and potentially applicable over large areas.
Although further studies involving a greater number of genotypes, environments, and growing seasons are required, the results indicate that remote sensing, when integrated with physiological and metabolic indicators, could become a valuable tool for phenological monitoring in sweet cherry production.
Source: Saavedra, G. M., Univaso, L., Sepúlveda, L., Gaete-Loyola, J., Nuñez, C., Lillo-Carmona, V., Castillo, V., Zambrano, F., & Almeida, A. M. (2026). Integrating Metabolomics, Physiology and Satellite Vegetation Indices to Characterize Dormancy Onset in Two Sweet Cherry Genotypes. Horticulturae, 12(4), 443. https://doi.org/10.3390/horticulturae12040443
Image source: Stefano Lugli
Andrea Giovannini
PhD in Agricultural, Environmental and Food Science and Technology - Arboriculture and Fruitculture, University of Bologna, IT
Cherry Times – All rights reserved