The California fruit growers are concerned about water resource limitations due to the increasing frequency of droughts. UCCE and UC researchers are collaborating to address these concerns with a scientific approach to irrigation management.
Many growers rely on pressure bomb measurements or crop coefficients provided by local UCCE offices to determine their crops' irrigation needs. New technologies for modeling or remote sensing of evapotranspiration estimates are emerging to help manage irrigation more precisely for optimal yields.
Evapotranspiration and Crop Water Status
Water losses due to soil evaporation and plant transpiration combine into a process called evapotranspiration, or crop water requirements. These losses must be replaced through irrigation to achieve healthy crops and optimal yield in terms of both quantity and quality.
We have methods that measure the amount of water used in agricultural fields from the air. When we use these measurements (called biometeorological measurements) to develop irrigation recommendations, we refer to them as ET-based irrigation.
This might be somewhat misleading, as the measured ET is not a simple amount to use. It must be increased to compensate for water losses along the irrigation network and account for sections of the plots with lower water distribution.
If a rain event has added a significant amount of water to the soil profile, irrigation must be reduced to account for this natural water input. This makes ET-based irrigation approaches complex for orchards and vineyards.
To more closely determine the water requirements of perennial crops, it is recommended to conduct plant-based measurements in addition to biometeorological measurements to determine the crop's water status. This helps inform our measurements with the plant's response to weather conditions, soil, and irrigation. Biometeorological measurements take plant biology into account and provide information on water use at the landscape level.
Therefore, the independent monitoring of plant water status using more physiological methods, such as stem water potential (SWP) measurements, offers an advantage. In our project, we aimed to combine the biometeorological approach to ET measurements and add soil moisture and SWP to better interpret the feedback between soil, plant, and atmosphere.
New Crop Coefficients from California Sweet Cherry Orchards
In response to one of the priorities of the sweet cherry industry and with the support of the California Cherry Board, we began a project in 2019 in three sweet cherry orchards in San Joaquin County, near Linden, California, to determine the local irrigation needs for cherries.
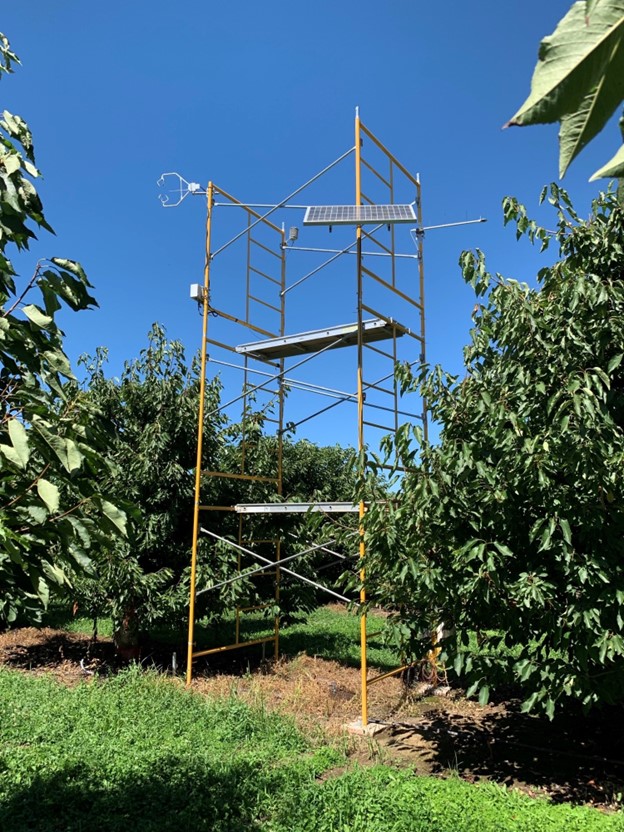 Image 1: Biometeorological covariance station for evapotranspiration measurement.
Our experiment included biometeorological ET measurements (Fig. 1), pressure chamber measurements of SWP (Fig. 2), and shallow soil moisture. We also contacted irrigation managers to use their data from neutron probe readings of soil moisture in the root zone, manually taken at several measurement points in each orchard.
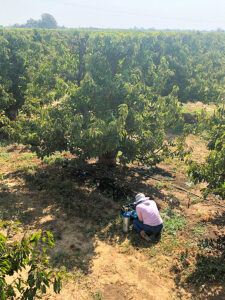 Image 2: Stem water potential measurements in progress.
The experiment was hosted by the same grower, and the mature sweet cherry orchards were located close to each other; the only differences between the three orchards were the tree row orientation, tree density (from the densest at 16 ft x 16 ft, to moderately sparse at 20 ft x 20 ft, and the sparsest at 22 ft x 20 ft), rootstock, and irrigation system (the sparsest orchard had sprinkler irrigation, while the other two were drip irrigated).
Our main goal was to use these measurements to develop crop coefficients (Kc), the universal correction from the reference grass evapotranspiration (ETo) to crop evapotranspiration (ETc).
Regulated Deficit Irrigation in California Sweet Cherry Orchards
The continued support of the sweet cherry industry helped us establish a new project in 2021, building on the one started in 2019. While our initial goal was to develop irrigation recommendations for fully irrigated orchards, the new project focused on regulated deficit irrigation.
Within the same three orchards where our measurements were already established, we began deficit irrigation in the post-harvest period by shutting off one of the two drip lines. Our monitoring again included SWP to check the water status between fully irrigated trees (control) and those subjected to post-harvest deficit irrigation (PDI).
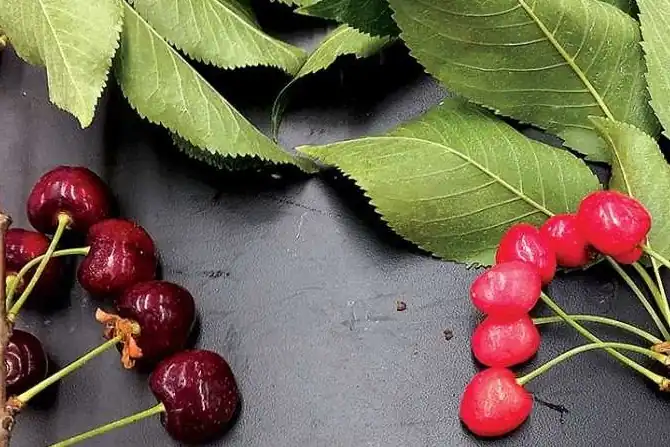
To fully assess the significance of PDI for the sweet cherry industry, we collected fruit samples (Fig. 3) from PDI trees and control trees and compared the difference in quality and quantity over two consecutive years.
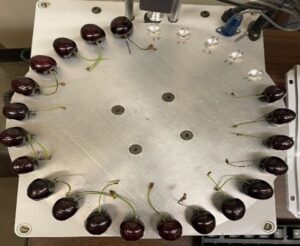 Image 3: Crop sampling and laboratory analysis.
Results
We developed a crop coefficient curve for sweet cherries under the local conditions of California. This is based on daily data of ETa collected over five years and from three orchards managed with full irrigation.
By averaging these 14 curves (we reduced the number of orchards from three to two during the first year of the COVID-19 pandemic) into a single curve, we aimed to represent different orchards and hydrological years for universal values to serve as guidance for the local sweet cherry industry.
When we modeled ETc based on the Kc values resulting from this measurement period, we observed significant variability across different years and orchards. Therefore, while our crop coefficient curve may be close to the irrigation needs of sweet cherries, it may also underestimate or overestimate actual ETa on a given day.
Our exploratory study with PDI shows a potential for water savings during the post-harvest period of sweet cherries (Table 1), ranging between 26% and 50%.
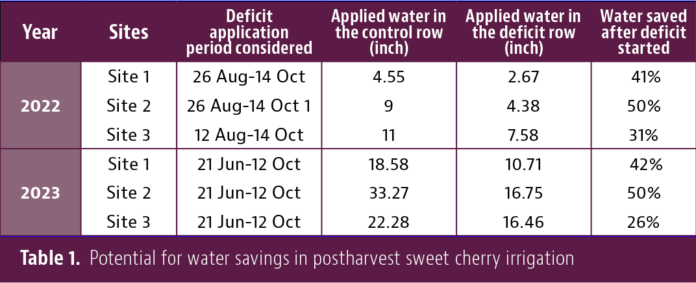 Table 1. Potential water savings in post-harvest irrigation of sweet cherries.
Our harvest data analysis shows that although there were some differences in yield, with an increase or decrease in yield quantity due to the deficit, there were no significant differences between control trees and those under PDI in yield or most fruit quality parameters. Some of the observed differences in fruit quality were inconsistent across orchards or treatments.
We developed a crop coefficient curve for sweet cherries under the local conditions of California, based on daily ETa data collected over five years from three fully irrigated orchards.
By averaging these 14 curves (we reduced the number of orchards from three to two during the first year of the COVID-19 pandemic) into a single curve, we aimed to represent different orchards and hydrological years for universal values to serve as guidance for the local sweet cherry industry.
When we modeled ETc based on the Kc values as a result of this measurement period, we observed significant variability across different years and orchards. Therefore, our crop coefficient curve may be close to the irrigation needs of sweet cherries but can also underestimate or overestimate actual ETa on a given day.
Our exploratory study with PDI shows a potential for water savings in the post-harvest period of sweet cherries (Table 1), ranging between 26% and 50%.
Study limitations
Although we collected a large amount of data to develop a universal crop coefficient curve for local conditions, it is limited to approximating specific water use due to the complexity of orchard water management systems.
Our results on PDI are very limited regarding sample size and duration (only two years), and long-term effects cannot be evaluated over such a short PDI period. The sample size collected was very labor-intensive for yield quality and quantity assessment, but large differences among trees within the same treatment may mask the statistical significance of observed differences.
Read the full article: Progressive Crop Consultant
Images: Progressive Crop Consultant
Cherry Times - All rights reserved