Leaf analysis in cherry orchards is an essential tool for efficient nutrition management. After identifying nutrient deficiencies or excesses, growers can make informed decisions to optimize fruit quality, growth, and orchard productivity.
Chile has positioned itself as one of the leading players in cherry production and marketing, with China as the primary destination market. The profitability of this crop is significant, driven by high international demand and competitive prices in the global market.
Cherry production has seen a consistent increase, with a forecast of reaching 500,000 tons for the 2024/25 season. This growth reflects not only the adaptability of the crop to Chilean climatic conditions but also the ability of producers to innovate and improve cultivation and post-harvest techniques.
To achieve good production and fruit quality, proper nutrition and fertilization are required. Without monitoring these two parameters, it is difficult to obtain an economically profitable production and high-quality fruits for the market.
In line with the above and with the goal of providing advice on nutrition and fertilization, the company Irrifer Ltda. was founded in 2004 in Chillán, in the Ñuble region, specializing in various nutritional diagnosis techniques for crops and fruit trees.
The services provided include soil and leaf analysis, nutritional monitoring, moisture monitoring, agronomic studies, agricultural research, training, and direct consultancy for farmers.
Leaf Analysis as a Nutrition Management Tool
Leaf analysis in cherry orchards is an essential tool for efficient nutrition management. This analysis determines the nutritional status of the plants by assessing nutrient levels in the leaves, providing crucial information to precisely adapt fertilization programs.
By identifying nutrient deficiencies or excesses, growers can make informed decisions to optimize fruit quality, growth, and orchard productivity. Therefore, leaf analysis not only contributes to sustainability but is also a fundamental practice for achieving quality standards for global markets.
In agronomy, the critical leaf concentrations that limit growth are usually determined by regression in response to variation in a single factor, although the results are site-specific.
In practice, however, various factors influence plant growth and development, and in different years, the adapted equations may differ from those adapted in previous years, mainly due to interactions with other factors.
Methodologies for Interpreting Leaf Analysis
There are various methods for interpreting leaf analysis. Those based on critical levels or sufficiency ranges are the most commonly used. However, Camacho et al. (2012) stated that methods determining reference values for nutritional diagnoses specific to the region can provide more accurate results.
The limit line method suggested by Webb (1972) involves plotting yield as a function of the evaluated characteristics, leaving only the points on the limit line and fitting a polynomial model to obtain the optimal value or the optimal range of nutrients in the leaf.
This method was suggested in biological experiments, where Webb (1972) stated that the relationships between variables are generally confused by other interacting factors. This means that data dispersion is not only the result of measurement errors and biological variability but also interactions with other factors.
The method has been used in various fields, such as in a study by Imhoff et al. (2010) to evaluate soil physical properties, by Schmidt et al. (2000) and Topp et al. (2013) to evaluate nitrous oxide (N₂O) emissions from agricultural soils, and by Shatar and McBratney (2004) to qualify soil chemical properties.
The limit line method has been preferred to evaluate plant nutritional status, mainly to determine the critical level or sufficiency range in leaves.
Walworth et al. (1986) applied this method to corn, while Njukeng et al. (2013) and Suchartgul et al. (2012) used it in rubber trees. Lafond (2013) obtained an optimal concentration and sufficiency range for nitrogen (N), phosphorus (P), potassium (K), calcium (Ca), and magnesium (Mg) for blueberries.
Quesnel et al. (2006) applied the methodology to conifers, while Rafique et al. (2008) used it to evaluate the nutritional status of onions.
As previously observed, data on nutritional status obtained using the limit line method allow for estimating the sufficiency range of leaf nutrients. Therefore, the aim of this study was to explore the relationship between yield and leaf nutrient concentration and propose sufficiency ranges in cherry leaves using the limit line method.
Diagnosis and Limit Line Methodology
Study Site Description
The borderline model proposed was applied using leaf data from the Irrifer Ltda. laboratory, corresponding to 248 samples collected during the 2022/23 and 2023/24 seasons, from commercial orchards in the central and central-southern regions of Chile, located between latitudes 30°50'08''S and 40°55'08''S.
All selected orchards are irrigated via drip irrigation and fertilized via fertigation. The most common planting frame is 4 x 2 m and the predominant varieties considered in the study were Regina, Lapins, Santina, Royal Dawn, and Skeena.
The predominant chemical characteristics of the soil in the study area are those indicated in Table 1 with their respective variation coefficients.
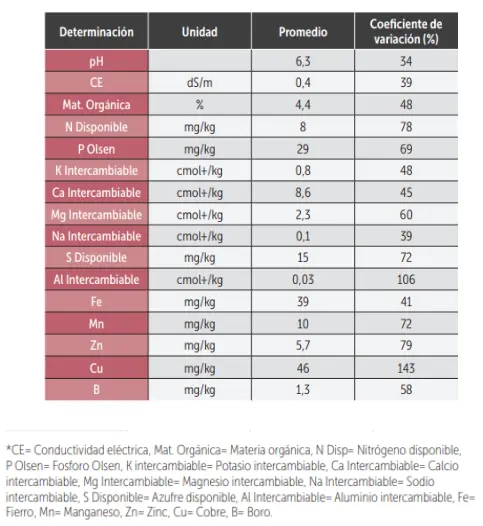 Table 1. Chemical analysis of soils characteristic of the study area
Preparation of Leaf Samples
The leaves were collected in two periods of the plant cycle: fruit growth (pre-harvest) and post-harvest. The newly mature leaves were sampled from the outer perimeter of the tree, preferably from the central third of the shoot.
At the end of the cycle, the respective fruit yield of each orchard was measured. After drying the plant material in a convection oven at 70°C until a constant weight, the material was ground and the concentrations of N, P, K, Ca, Mg, sulfur (S), iron (Fe), zinc (Zn), manganese (Mn), boron (B), and copper (Cu) were determined according to the methods described by Sadzawka et al. (2004).
Limit Line Methodology
The "Border Line" or "Limit Line" procedure is based on the methodology applied by Bhat and Sujatha (2013). For this purpose, two databases were created with information from leaf analysis of cherries during the fruit growth and post-harvest stages, which were associated with the obtained fruit yields.
Considering these two variables, nutrient concentration as the independent variable and crop production as the dependent variable, scatter plots were created with the various nutrient concentrations at the leaf level (Figure 1).
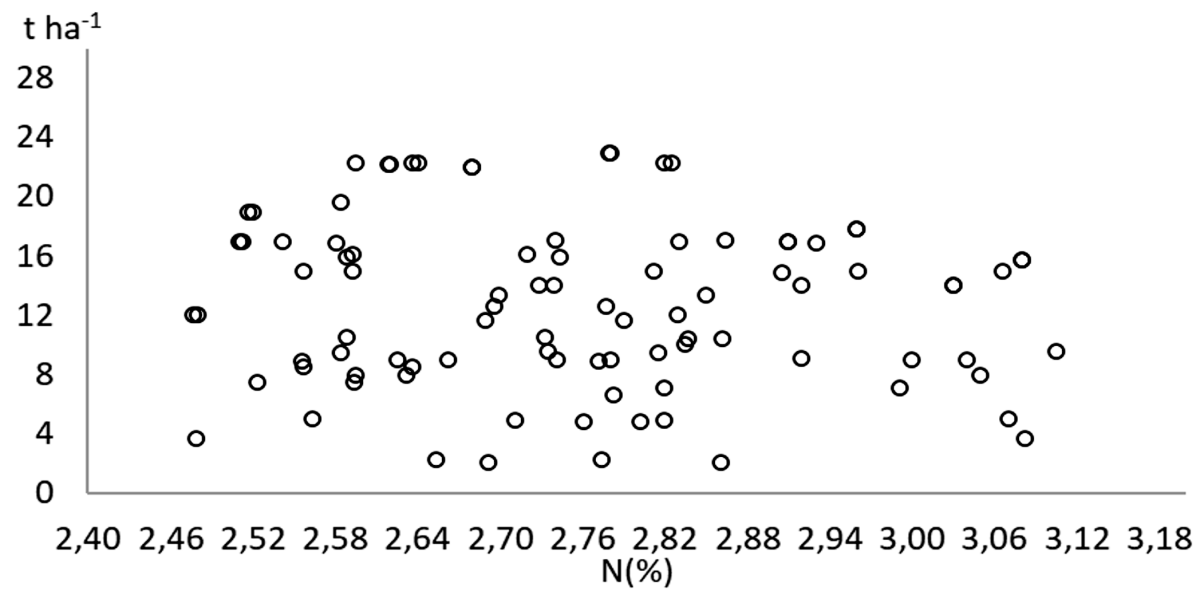 Figure 1. Dispersion of leaf nitrogen concentration (N%) in cherries as a function of yield (t/ha-1).
After obtaining the scatter plot with all the data, the independent variable was divided into 8-12 segments (Figure 2), and once the plot was divided, the highest performance data in each range were selected.
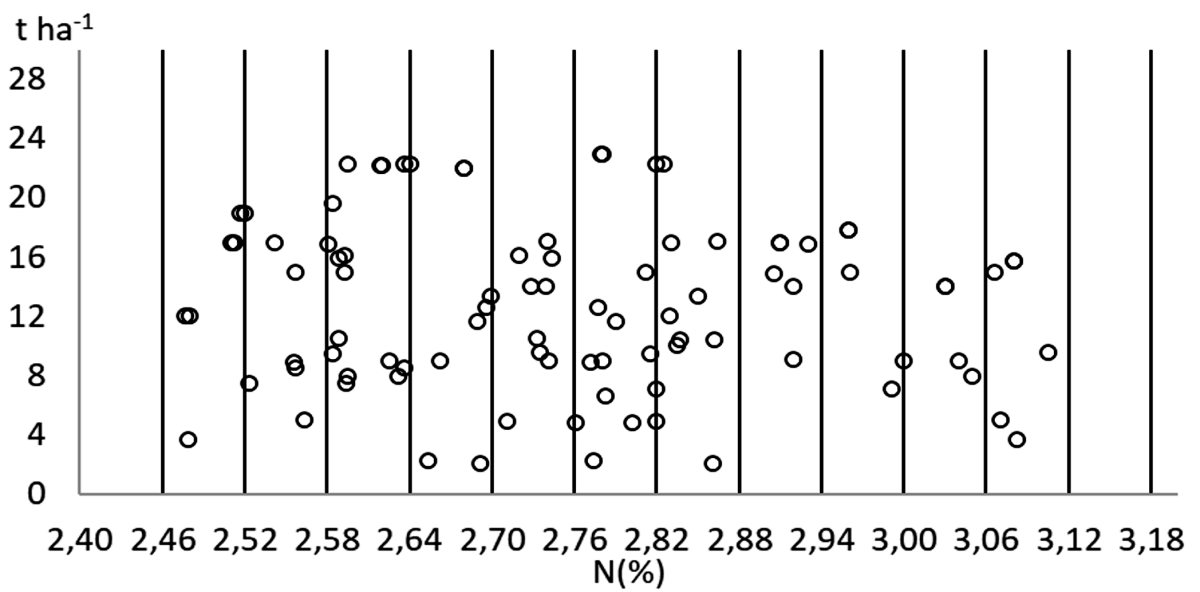 Figure 2. Example of segment division of the graph associating % nitrogen (N%) to yields (t/ha-1).
These points are called "boundary" or "limit" (Figure 3).
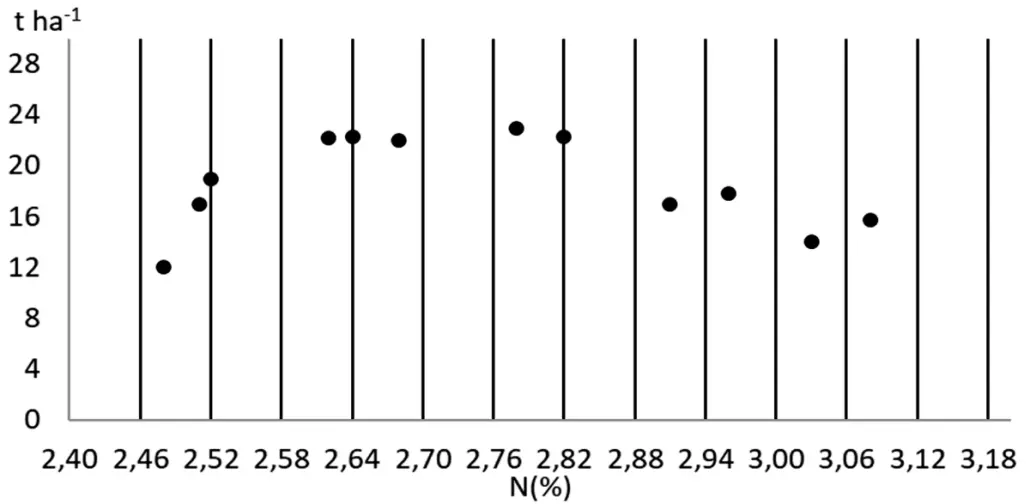 Figure 3. Selection of boundary points of leaf nitrogen concentration (N%) relative to yield (t/ha-1).
With the points chosen in each segment, a polynomial function is drawn, representing a curve called the "boundary line" or "limit line" (Figure 4).
To create the optimal intervals of leaf concentration, the concentrations corresponding to the polynomial with slope 0, i.e., the maximum point of the function, are calculated, and the optimal or reference concentration intervals are estimated for yield values greater than 90% of the maximum production.
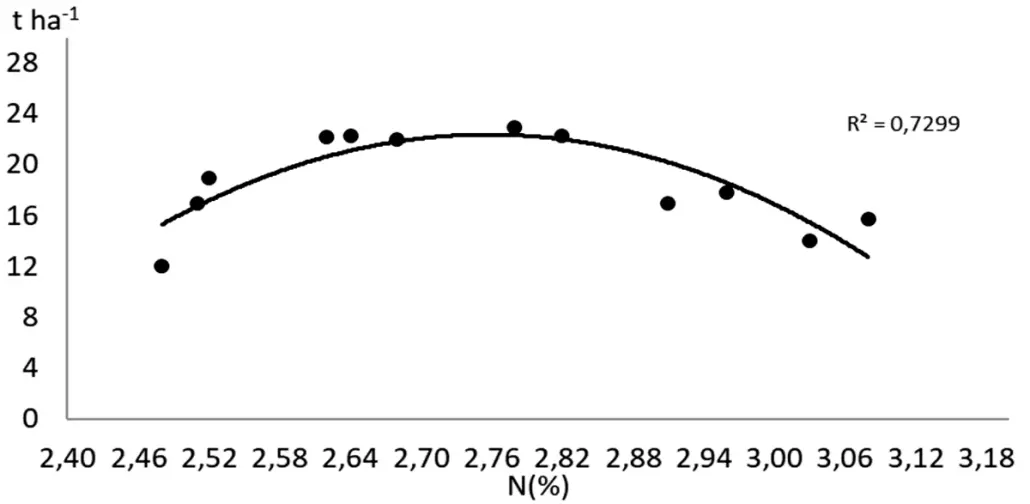 Figure 4. Graphical representation of the polynomial function relating leaf nitrogen % (N%) to yield (t/ha-1) corresponding to the points on the limit line.
The same methodology indicated above was applied to the ratios N:P, N:K, P:K, K:Ca, K:Mg, Ca:Mg, P:Zn, Ca:B, which were estimated by dividing the respective nutrient concentrations in the leaves.
Optimal Nutrient Ranges and Recommendations
The results of this study clearly suggest that the methodology used is useful for establishing leaf reference standards for cherries, which could be more representative of the pedoclimatic conditions of the area where this fruit tree is produced in Chile.
Table 2 summarizes the optimal reference range obtained using the limit line method, compared to the ranges used by national laboratories, derived mainly from foreign literature.
From this table, it can be deduced that some nutrients, such as N, P, Mn, and Cu, exceed the reference values found in literature. Meanwhile, for elements like Ca and Mg, the minimum reference range is significantly lower than those described in literature.
The other nutrients do not significantly differ from those indicated in international references.
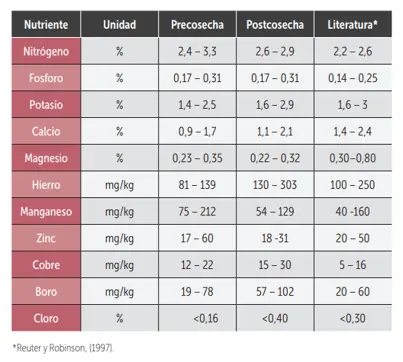 Table 2. Optimal reference ranges for leaf nutrient concentrations in cherries developed using the limit line method based on international literature.
Based on the optimal levels, it can be noted that the order of importance of nutritional requirements for this species corresponds to N > K > Ca > Mg > P > Fe > Mn > B > Zn > Cu.
It should be noted that the latter element is influenced by the high variability in the sampling sites, where some soils analyzed reached levels exceeding 100 mg Cu/kg, as a consequence of the industrial activity present in these areas.
Optimal Nutritional Ratios
Considering the importance of maintaining a nutritional balance between nutrients, some optimal ratios have been calculated as indicators of their balance level.
The optimal relationships for some nutrients were developed from polynomial equations, which showed a significant level of fit with R² in the range 0.65-0.96.
The reference values for the nutritional ratios are presented in Table 3, from which it can be inferred that values deviating from these ranges would reflect a nutritional imbalance and/or problems with nutrient antagonism.
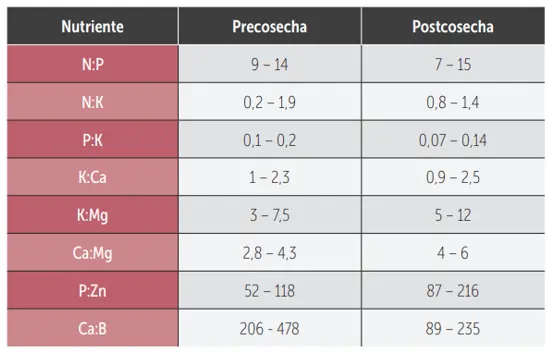
Table 3. Ranges of relationships between leaf nutrients in cherries, developed with the limit line method.
Current Nutritional Situation of Cherry Trees
After establishing the sufficiency ranges, the nutritional status of the sampled cherry trees was evaluated.
Table 4 shows the percentage of samples identified in the optimal, deficient, and excessive categories at the leaf level.
From this table, it can be deduced that the greatest limitations due to deficiency are:
- Mn in 48% of the samples
- Ca in 40% of the samples
- P in 37% of the samples
Meanwhile, due to excess, Cl affected 43% of the samples.
Other nutrients, such as B, Mg, N, Cu, and Zn, were mostly within the sufficiency range in over 70% of the orchards.
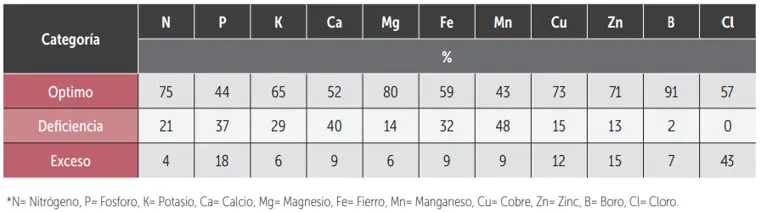 Table 4. Percentage of areas with low fruit yields without nutritional restrictions and with limitations due to nutrient deficiency and excess evaluated using the limit line method.
Recommendations
From the results obtained in this research, we can deduce the following recommendations:
- The methodology used allowed for the generation of leaf reference standards that are more representative of the pedoclimatic conditions of the region, which can improve the accuracy of the nutritional status evaluation of cherry trees.
- By identifying specific sufficiency intervals for nutrients, which in some cases differ from those reported in foreign literature, it is possible to better customize fertilization programs, thereby optimizing fruit yield and quality.
- The optimal relationships between nutrients and the reference intervals generated provide clear indicators of nutritional balance, which is essential for detecting and correcting imbalances, deficiencies, and/or excesses of nutrients.
- This study provides specific data and methodologies that can be used in future research to further improve the nutritional management practices of cherry trees and, possibly, other species.
Extracted from: Iván Vidal and Fernando Valenzuela, University of Concepción, Irrifer Ltda, Chile
Source: Redagricola
Cherry Times - All rights reserved