In clonal cherry orchards, every tree shares the same genetic background. Yet walking the rows reveals clear differences in structure and fruit load between neighbouring plants. Quantifying that variability at block scale remains a practical challenge, and averages systematically hide it.
Digital phenotyping aims to make this variability measurable and traceable at the individual plant level.
How Phenoria works
Phenoria is a smartphone-based tool we are developing for digital phenotyping of fruit trees, to extract plant information from a single photo per plant.
From that image, an AI model detects and counts individual fruits, segments the canopy structure, and quantifies variables such as foliar coverage, canopy density, foliage maturity, vertical foliage and fruit distribution, leaf-to-fruit ratio, etc.
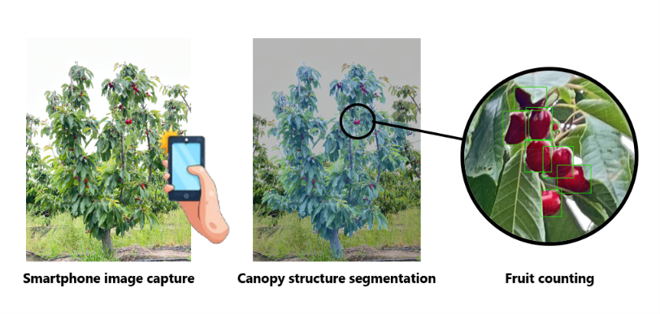
Figure 1. Phenoria pipeline: from smartphone image capture to canopy structure segmentation and fruit counting.
Two divergent phenotypes within the same orchard
Working in a commercial cherry orchard near harvest, we compared the structural phenotype of trees in the top 20% of fruit load (755 fruits/plant on average) against those in the lowest 20% (137 fruits/plant on average). The patterns diverged clearly.
High-load trees shared open canopies, lower foliar coverage, more mature foliage, and lower leaf-to-fruit ratio: fruit exposed, architecture tilted toward reproduction.
Low-load trees shared dense canopies, abundant active shoot growth, and much higher leaf-to-fruit ratio: fruit hidden, architecture tilted toward vegetative growth.
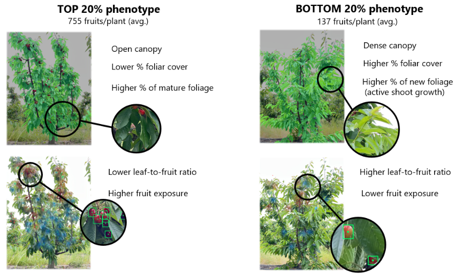
Figure 2. Comparison of structural phenotypes between trees in the top 20% and bottom 20% of fruit load within the same orchard block.
Mapping the variability across the block
Mapping these phenotypes spatially within the block revealed distinct sectors concentrating high-load and low-load trees.
Interestingly, in the low-load sectors the trees appeared most vigorous from drone imagery, consistent with the dense canopies and active vegetative growth that Phenoria detected at ground level.
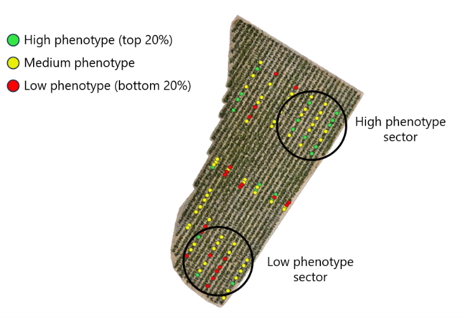
Figure 3. Drone-based map of the orchard block showing the spatial distribution of high- and low-load phenotypes.
Where the explanation should be sought
A single smartphone photo cannot explain why those sectors diverge. The drivers often lie in soil, irrigation, or management history. But it can point precisely to where that explanation should be sought.
Image source: Tomás del Campo Smith
Tomás del Campo Smith
Phenoria
Cherry Times - Tutti i diritti riservati