In brief. As part of a field service in Romeral, Chile, for a Chilean export company, we tested whether artificial intelligence applied to ordinary smartphone photos could make the pre-season estimate of a cherry block's floral offer faster and more representative. The finding was not a single universal model but a rule: in open canopies, direct dart detection works; in dense, occluded ones, detection fails and plant structure becomes the better predictor.
The problem. Estimating the floral offer before the season relies on counting fruiting darts by eye, plant by plant. It is slow, operator-dependent and rarely georeferenced, leaving growers with a single global figure that says nothing about the variability within a block. More capable hardware exists, from vehicle-mounted sensors to multi-view 3D reconstruction, but such systems need terrain a vehicle can drive, which steep slopes and narrow, high-density rows do not always allow.
We deliberately chose the tool the grower already carries: the smartphone, one quick photo per plant, fast enough to sample many plants and gain representativeness.
How it works
How it works. A single image never captures every dart because of occlusion, so the model does not count directly: it learns the relation between what the AI detects and what is really there, calibrated with manual counts. This limitation is not unique to smartphones; even advanced systems must be calibrated for occluded structures.
Both detection and structural analysis run through Phenoria, a smartphone-based phenotyping tool for fruit trees that turns a single photo into structural and floral-load data, currently in development, with more news coming soon.
Figure 1. Direct AI dart detection performs best in open-canopy orchards with minimal occlusion, whereas structural segmentation adds noise when darts are clearly visible.
Dense canopies
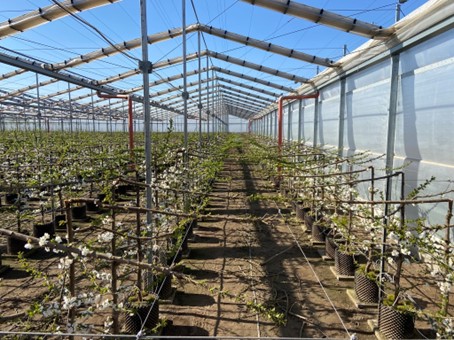
Figure 2. In dense canopies with high occlusion, direct dart detection fails; estimation using plant structural segmentation serves as a more reliable proxy for load capacity.
What we found. Across several orchards, occlusion decided which method worked. In open canopies, dart detection reached an R² of 0.53 in validation, enough to map load zones though not to predict single plants. In dense canopies, detection collapsed; modeling load from plant structure alone recovered a usable signal, an R² of 0.24, enough to separate high-load from low-load zones.
The most revealing result: under severe occlusion, adding dart detection to the structural model made it worse. When you cannot see the darts, you measure the tree that bears them.
Spatial variability
Figure 3. Spatial variability map generated from single-photo sampling points (orange dots), dividing the block into two distinct management zones displaying mean estimated dart count +- standard deviation.
The takeaway. There is no universal predictor: open canopies favor counting, dense canopies favor structure, both from one accessible photo. And a low R² is not a useless model, it depends on the decision it must support: ranking a block into zones demands far less precision than predicting one plant, and it is exactly what a grower needs to act early.
The broader aim is to extract the maximum plant information from a single smartphone photo, throughout the season. Agtech must solve real field problems with what growers already carry.
José Salinas Navarrete
Geospectra
Cherry Times - All rights reserved