
Alessandro Palmieri - University of Bologna (IT)
Cherry Times technical-scientific committee
Parallel to the growth in supply, the world trade in cherries has also been expanding for some time, albeit at a much faster pace. In the decade from 2013 to 2022, in fact, world production increased from 2.3 to 2.75 million tonnes, an increase of about 20%, while trade flows rose from 350,000 to 940,000 tonnes (Figure 1), thus registering a growth of 266%.
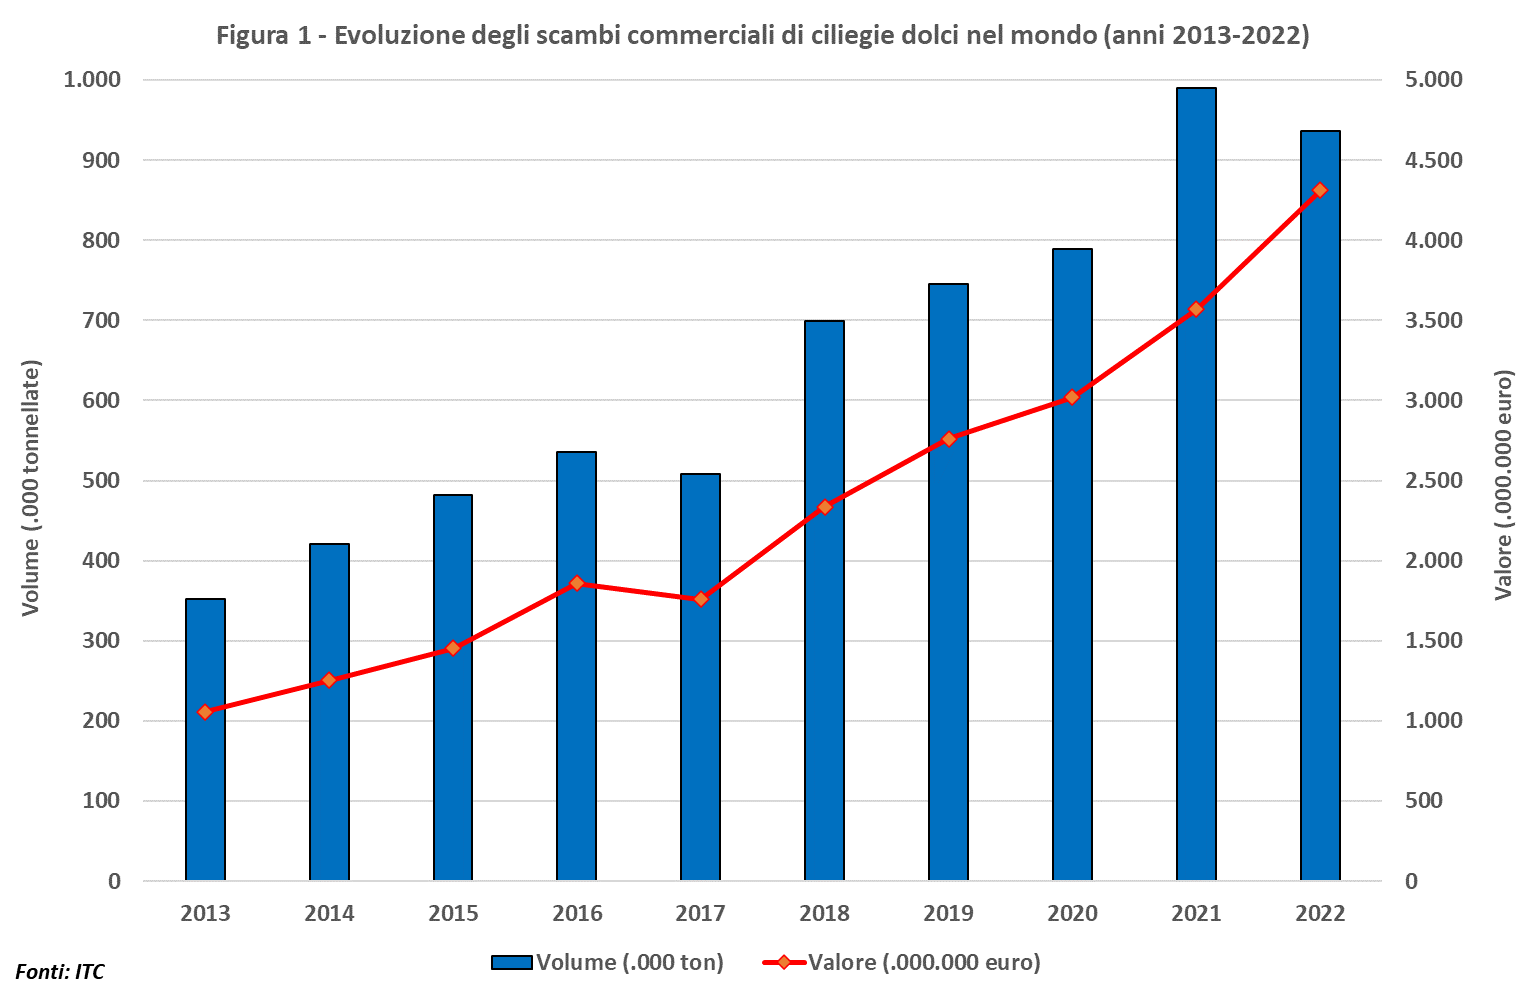 Image 1: Evolution of sweet cherries world trade (2013-2022).
While in 2013 the percentage of traded product in the total produced amounted to 15%, in 2022 it represented more than 33%. It is also interesting to highlight the gradual growth of average traded prices, which rose from around 3 euros/kg in 2013 to 3.6-3.8 euros/kg in the three-year period 2019/21, to jump to 4.6 euros/kg in 2022, so much so that in the very last year examined, the value of the traded goods reached a record 4.3 billion euros.
On the export side, Table 1 shows the current parameters and the evolution recorded in the decade considered for the main world countries. In particular, the top 12 exporting countries currently account for more than 90% of total exports, while the top 3 (excluding Hong Kong, which is merely a transit hub), i.e. Chile, Turkey and the United States cover a share of 50%.
Table 1 - Summary data of the main cherry exporting countries in the world (2013-2022). Sources: ITC.
* Annual rate of Change ** (Exp-Imp)/(Exp+Imp) |
| Countries | Ranking 2022 | Average export per five-year period | Share (%) | Evolution (%) | Average price (€/Kg) | Normalised balance **(%) |
| 2013/17 (A) | 2018/22 (B) | 2013/17 | 2018/22 | D (B/A) | TAV * | 2013/17 | 2018/22 | 2013/17 | 2018/22 |
| Chile | 1 | 84,5 | 273,8 | 18,4 | 32,9 | 224,0 | 23,9 | 3,90 | 4,46 | 100,0 | 100,0 |
| Hong Kong | 2 | 50,6 | 189,4 | 11,0 | 22,8 | 274,3 | 33,1 | 3,54 | 4,31 | -17,8 | -2,5 |
| Türkiye | 3 | 62,3 | 74,2 | 13,6 | 8,9 | 19,0 | 2,8 | 2,08 | 2,11 | 100,0 | 99,9 |
| United States | 4 | 82,4 | 68,7 | 17,9 | 8,3 | -16,6 | -4,0 | 4,90 | 5,98 | 74,8 | 62,9 |
| Azerbaijan | 5 | 11,0 | 25,7 | 2,4 | 3,1 | 133,1 | 19,4 | 1,39 | 1,38 | 98,0 | 99,0 |
| Uzbekistan | 6 | 6,1 | 38,3 | 1,3 | 4,6 | 525,6 | 5,9 | 1,94 | 1,95 | 100,0 | 100,0 |
| Spain | 7 | 25,1 | 28,9 | 5,5 | 3,5 | 15,4 | 1,9 | 2,54 | 2,98 | 90,5 | 81,5 |
| Greece | 8 | 19,8 | 23,8 | 4,3 | 2,9 | 19,8 | 2,7 | 1,74 | 1,90 | 96,0 | 99,4 |
| Canada | 9 | 9,3 | 9,6 | 2,0 | 1,1 | 2,5 | 2,3 | 4,83 | 6,26 | -48,7 | -46,1 |
| Moldova | 10 | 5,2 | 8,5 | 1,1 | 1,0 | 63,9 | -0,1 | 0,63 | 0,66 | 67,7 | 96,2 |
| Iran | 11 | 4,7 | 10,8 | 1,0 | 1,3 | 132,4 | 11,4 | 0,91 | 1,04 | 100,0 | 100,0 |
| Italy | 12 | 8,3 | 6,4 | 1,8 | 0,8 | -22,9 | -2,3 | 3,69 | 4,33 | -3,5 | -20,4 |
The table shows, for each country, the average volume of product exported in the two five-year periods that make up the period of observation, the relative share in the total exported in the world, the average price of the goods exported and the dynamics of the period expressed both in terms of differential value between the averages of the two five-year periods, and as the average annual rate of change of the entire decade.
Finally, the normalised balance of each country is also reported, again with reference to the two sub-periods identified, in order to understand the country's trade position (exporter, importer or neutral).
Chile is increasingly confirmed as the absolute leader in terms of exported volumes, with an average that has risen from 85,000 tonnes in the five-year period 2013-2017 to almost 274,000 tonnes in the period 2018-2022, showing an average annual growth rate of 24%. The share thus rose to around 33%.
The second position is currently held by Hong Kong, which over time has increasingly become the transit hub of choice for the Asian region, as evidenced by the normalised balance of the last five years, equal to -2.5%, which indicates an almost total re-export of imported volumes.
Turkey, the world's third largest exporter, expands its flows by 19%, but loses out in terms of share due to the tumultuous growth of Chile, as well as other countries that have recently decisively entered the market. In contrast, the United States is the only one of the top exporting countries to show a downward trend, from 82,000 to 68,000 tonnes in the two periods considered, for a share currently worth 8.3%.
Next in line are the two largest emerging countries on the world trade scene, namely Azerbaijan and Uzbekistan, which are recording increases at an average annual rate of 20 and 6%, albeit with very fluctuating flows. Then, with volumes between 20 and 30,000 tonnes per year, are the two main European players, Spain and Greece, which both show a rather similar expansion trend, between 15 and 20% overall.
Finally, Italy currently ranks 12th in the world, with extremely fluctuating flows, which are affected by fluctuating domestic production, so much so that they have varied from 2,500 to 12,500 tonnes in the 10 years examined. The tendential data, however, is downward (-2.3 % on an annual basis), and the world share now does not reach 1%, placing Italy among the importing countries, with a normalised balance of -20% over the last five years.
Italy nevertheless maintains its high export positioning in terms of price, with values above 4.3 euro/kg on average over the last five years. Only the United States and Canada are on decidedly higher levels, while Chile is basically on a par.
The remaining main exporting countries, on the other hand, are clearly oriented towards low-cost goods, with values between 2 and 3 euro/kg for Turkey, Spain and Greece and lower for the other cases examined, with lowest peaks below 1 euro/kg for Moldova and Iran. On the import side, Table 2 presents information quite similar to Table 1, but referring to the world's main importing countries.
Table 2 - Summary data of the main cherry importing countries in the world (2013-2022). Sources: ITC
* Annual Rate of Change ** (Exp-Imp)/(Exp+Imp) |
| Countries | Ranking 2022 | Average import per five-year period | Share (%) | Evolution (%) | Average price (€/Kg) | Normalised balance **(%) |
| 2013/17 (A) | 2018/22 (B) | 2013/17 | 2018/22 | D (B/A) | TAV * | 2013/17 | 2018/22 | 2013/17 | 2018/22 |
| China | 1 | 81,0 | 254,2 | 17,3 | 30,6 | 213,8 | 25,9 | 6,40 | 6,38 | -100,0 | -100,0 |
| Hong Kong | 2 | 66,6 | 200,3 | 14,2 | 24,1 | 200,6 | 23,9 | 4,71 | 4,95 | -17,8 | -2,5 |
| Russia | 3 | 62,2 | 84,4 | 13,3 | 10,2 | 35,6 | 4,8 | 1,25 | 1,43 | -100,0 | -99,8 |
| Germany | 4 | 40,7 | 46,3 | 8,7 | 5,6 | 13,8 | 3,1 | 3,01 | 3,16 | -77,9 | -80,8 |
| United States | 5 | 11,7 | 14,6 | 2,5 | 1,8 | 24,9 | 5,9 | 4,99 | 6,23 | 74,8 | 62,9 |
| Canada | 6 | 27,0 | 26,4 | 5,8 | 3,2 | -2,2 | -0,8 | 3,91 | 4,71 | -48,7 | -46,1 |
| United Kingdom | 7 | 17,0 | 14,2 | 3,6 | 1,7 | -16,6 | -2,5 | 3,07 | 3,50 | -97,5 | -94,2 |
| Taiwan | 8 | 9,1 | 11,9 | 1,9 | 1,4 | 30,0 | 22,3 | 6,63 | 7,94 | -100,0 | -100,0 |
| South Korea | 9 | 13,3 | 15,4 | 2,8 | 1,9 | 15,9 | 3,1 | 7,94 | 8,38 | -100,0 | -100,0 |
| Austria | 10 | 8,4 | 13,0 | 1,8 | 1,6 | 55,5 | 9,1 | 3,40 | 3,41 | -15,5 | -23,3 |
| Iraq | 11 | 8,1 | 11,9 | 1,7 | 1,4 | 47,0 | -6,0 | 0,33 | 0,47 | -100,0 | -99,9 |
| Italy | 16 | 8,5 | 9,5 | 1,8 | 1,1 | 12,2 | -0,3 | 2,44 | 2,74 | -3,5 | -20,4 |
The leading countries in this last decade have been China and Hong Kong, whose imports are worth a total of 55% over the last five years, compared to less than 30% in the previous period. Both countries show a growth rate of around 25% on average per year.
Russia also increased significantly, consolidating its position as the third largest country in terms of demand, with almost 85,000 tonnes of imports in the five-year period 2018-2022, for a share of over 10%. On lower volumes, but quite similar in terms of growth rates, instead, are the United States and Germany, the European Union's first market in order of importance.
Taiwan and South Korea, on the other hand, complete the picture of the evident development of cherry consumption in the Asian Far East. In contrast, Canada and the United Kingdom are the only countries with a buoyant demand among the top ten.
As far as Italy is concerned, it ranked 16th among importing countries in 2022, with average volumes of 9,500 tonnes in the second half of the decade examined and 8,500 in the first half. The country's dynamics are substantially stable, subject to strong fluctuations due to higher or lower domestic production.
It is interesting to note that, with regard to the average price of the imported product, Italy's is among the lowest among the main importers, at around 2.5 euro/kg. Only Russia and Iraq, among the top importers, demand a lower-priced product, while the average quotation of the other major countries is considerably higher, among which the Asian destinations clearly stand out, particularly China, Taiwan and South Korea with prices ranging from 6 to 8 euro/kg.
Around EUR 5/kg is the import price for the United States and Canada, while the main European importers, Germany and Austria, are trading at just over EUR 3/kg.
Cherry Times - All rights reserved